Air quality in Vancouver
Air quality index (AQI⁺) and PM2.5 air pollution in Vancouver • 413.5K Followers • 03:00, Jan 29 Local time
16
US AQI⁺Good

Main pollutant:
PM2.5
2.9 µg/m³
8°
29.6 km/h
97 %
Hourly forecast
Vancouver air quality index (AQI⁺) forecast
Daily forecast
Vancouver air quality index (AQI⁺) forecast
| Today | 14 | 100% | 9° 6° | 18 km/h | 90% |
| Fri | 20 | 100% | 9° 7° | 25.2 km/h | 93% |
| Sat | 31 | 100% | 9° 7° | 14.4 km/h | 97% |
Air pollutants
What is the current air quality in Vancouver?
PM2.5 concentration currently meets the WHO annual PM2.5 guideline.

Health recommendations
Enjoy outdoor activities |
Open your windows to bring clean, fresh air indoors Get a monitor |
Protect yourself from air pollution in Vancouver
Shop IQAir productsWhen the air becomes a problem – we provide relief
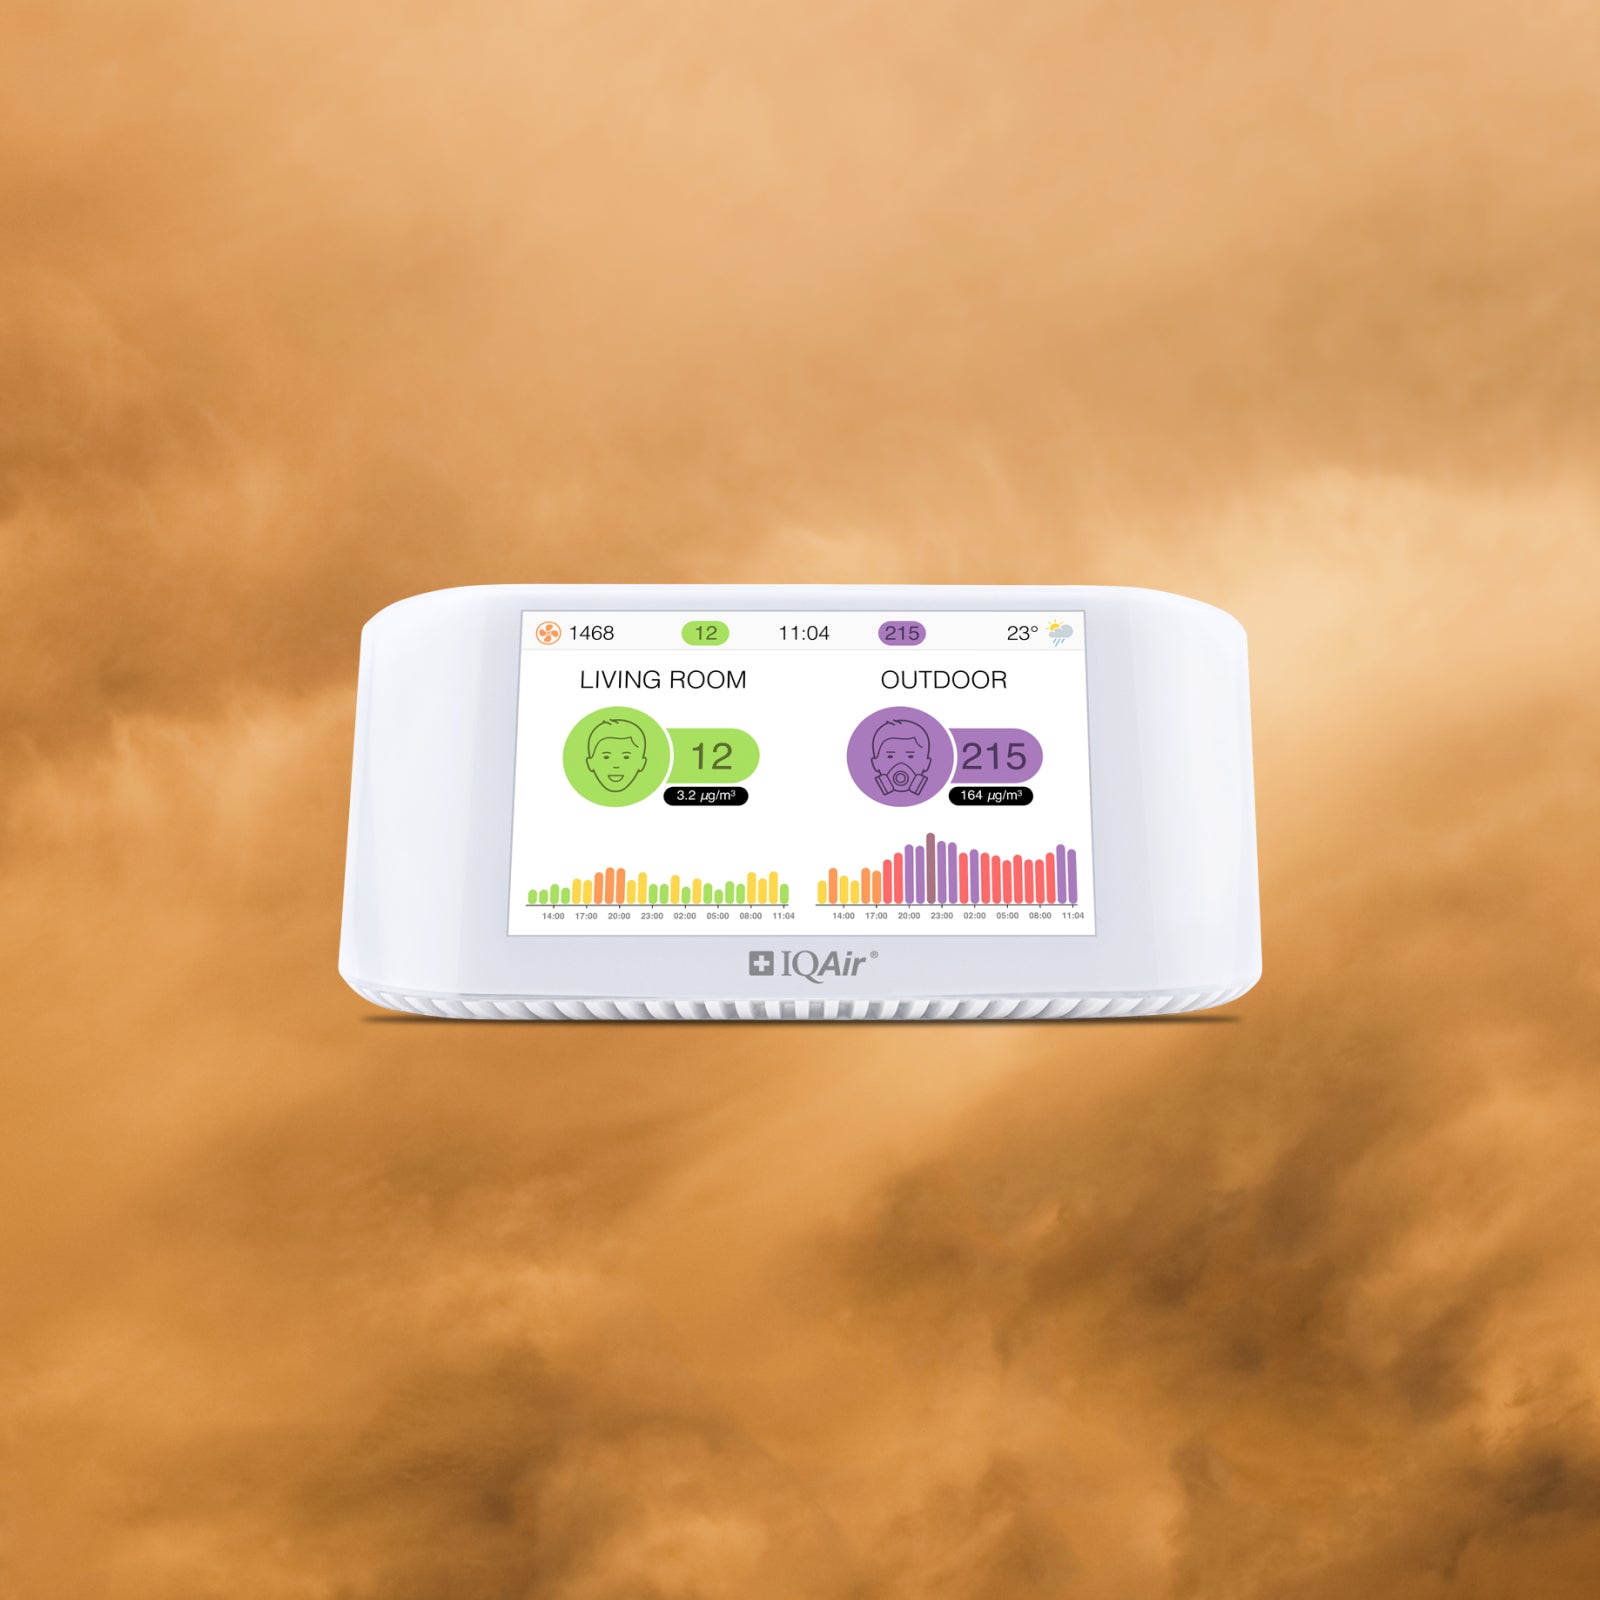
Monitor the air you breathe
Get accurate AirVisual air quality readings and real-time insights for cleaner air. Monitors that reveal pollution sources, highlight when air purifier use is needed.
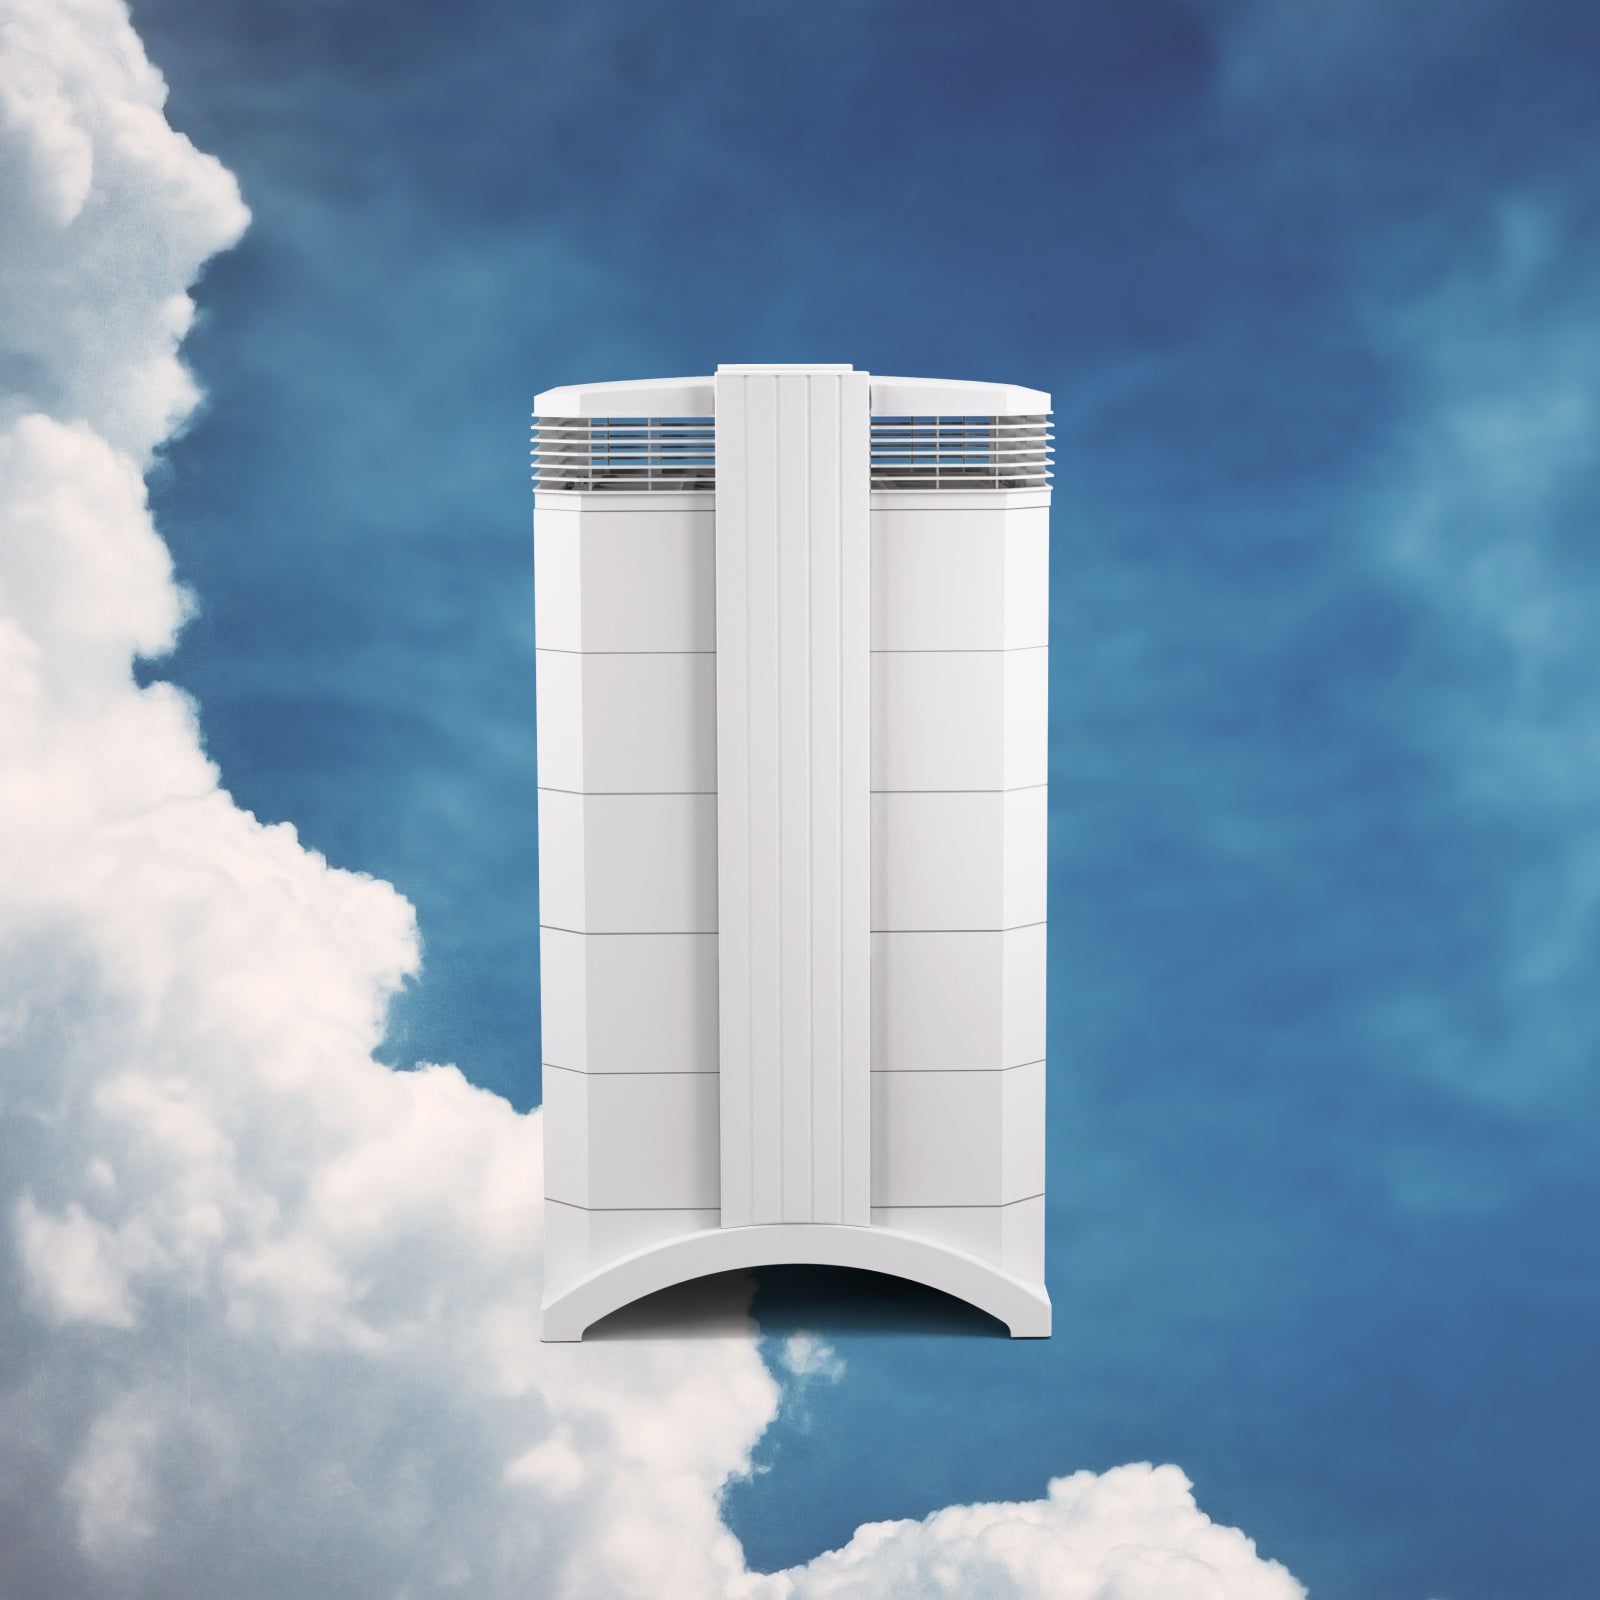
Medical grade air purifiers
Trusted worldwide, the HealthPro Series uses HyperHEPA technology. Filters ultrafine particles other air purifiers miss, delivering medical-grade protection.
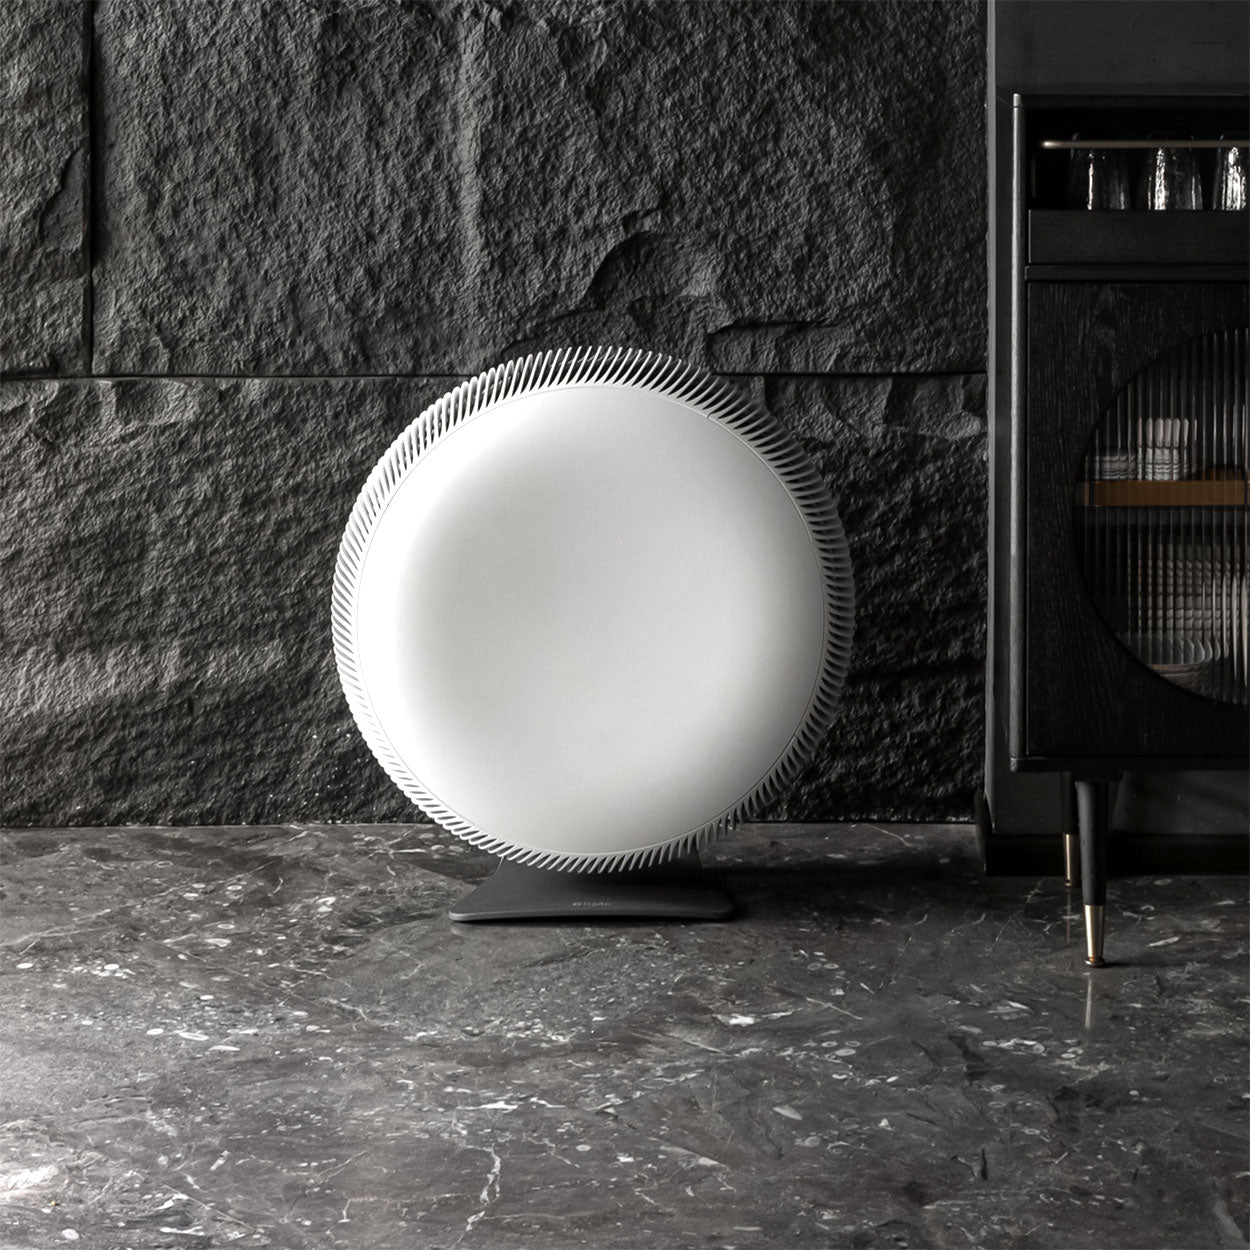
Powerful, stylish air purifiers
Compact and powerful, the Atem Series combines Swiss engineering with high-performance air purification, filtering ultrafine particles with HyperHEPA technology.
Pollen
What is the pollen count in Vancouver today?
Index

None
Tree None | 0% |
Grass None | 0% |
Weed None | 0% |
Source:
wetter.comHealth recommendations
Enjoy outdoor activities |
Open your windows to bring clean, fresh air indoors Get a monitor |
Pollen
What is the pollen count in Vancouver today?
Index
None
Tree None | 0% |
Grass None | 0% |
Weed None | 0% |
Source:
wetter.comProtect yourself from air pollution in Vancouver
Shop IQAir productsWhen the air becomes a problem – we provide relief
Monitor the air you breathe
Get accurate AirVisual air quality readings and real-time insights for cleaner air. Monitors that reveal pollution sources, highlight when air purifier use is needed.
Medical grade air purifiers
Trusted worldwide, the HealthPro Series uses HyperHEPA technology. Filters ultrafine particles other air purifiers miss, delivering medical-grade protection.
Powerful, stylish air purifiers
Compact and powerful, the Atem Series combines Swiss engineering with high-performance air purification, filtering ultrafine particles with HyperHEPA technology.
Most polluted locations near Vancouver
Worldwide AQI⁺ rankingStation ranking
Real-time Canada AQI⁺ station ranking
City ranking
Real-time Canada AQI⁺ city ranking
Historic air quality near Vancouver
History
Historic air quality graph for Vancouver
Historic air quality near Vancouver
History
Historic air quality graph for Vancouver
Most polluted locations near Vancouver
Worldwide AQI⁺ rankingStation ranking
Real-time Canada AQI⁺ station ranking
City ranking
Real-time Canada AQI⁺ city ranking


Measure your own air quality
Get a monitor and contribute air quality data in your city.
Learn more about air pollution in Vancouver
Does Vancouver have good air quality?
On average, air quality in Vancouver, British Columbia (B.C.) is deemed healthy for typically posing little to no risk to health. While annual air quality averages rank Vancouver among the cleanest major cities in the world, unhealthy short-term pollution spikes are not uncommon. In 2019, there were 30 such incidents of short-term pollution where an “incident” is described as:1
- 24-hour average PM2.5 concentration greater than 25 μg/m3
- 1-hour average nitrogen dioxide (NO2) concentration greater than 200 μg/m3
- 24-hour average sulfur dioxide (SO2) concentration greater than 20 μg/m3
- 8-hour ground-level ozone (O3) concentration greater than 52 ppb
When evaluating Vancouver air quality, it is important to keep in mind that Canada’s Environmental Protection Agency (EPA) sets a high bar. This is particularly true for PM2.5 and ozone, the most dangerous and prevalent pollutants in B.C. and greater North America.
For PM2.5, Canada's standard for annual exposure is 8 μg/m3, 20 percent lower than the World Health Organization (WHO) standard of 10 μg/m3, and a third lower than the United States’ EPA standard of 12 μg/m3. For ozone, Canada’s standard for annual exposure is 63 ppb, 10 percent lower than the US standard of 70 ppb (which was recently reduced from 75 ppb in 2015).
Even by these stringent national standards, a majority of Metro Vancouver stations met attainment for both PM2.5 and ozone in 2018. Only two sites in the city exceeded standards: Maple Ridge and Langley, both for ozone.2
Despite air generally meeting government standards, the City of Vancouver warns that adverse health effects can still impact residents, echoing the WHO’s statement that no level of pollution has been found to be free of health risk. Sensitive groups, such as children, the elderly, and those with pre-existing heart and lung disease are more likely to experience consequences from Vancouver air pollution.
Air quality in British Columbia is fast-changing and dynamic. Even across Metro Vancouver, air pollution levels can vary based on proximity to local emission sources, season, and time of day. Follow Vancouver’s live air quality data at the top of this page as well as individual stations for hyper-local conditions. Concentrations for all measured air pollutants are provided in the “pollutants” section.
How polluted is Vancouver, B.C.?
Relatively speaking, air quality in Vancouver, British Columbia is not particularly poor. In 2019, Residents here were exposed to 6.1 μg/m3 of PM2.5 pollution – less than the typical Canadian resident, who’s exposed to 7.7 μg/m3.
In the annual World Air Quality Report, Vancouver ranked 549th for cleanest air of 4,682 included global cities in 98 countries. Within Canada, Vancouver is ranked 65 for cleanest air in the country out of 168 included locations with ground-based PM2.5 stations and yearly data availability.
Just miles away, West Vancouver air quality fared significantly better with an annual average PM2.5 concentration of 4.4 μg/m3, ranking 10th for cleanest city in the country (though only differing from Metro Vancouver by 1.7 μg/m3).
For context, Canada’s three most polluted cities in 2019 were all in British Columbia: Kitwanga (19.4 μg/m3), Halfmoon Bay (14.7 μg/m3), and Clearwater (13.9 μg/m3). Each of the cities are greatly affected by seasonal particle pollution as a result of winter wood burning and cool air inversions. Canada’s three cleanest air cities were Labrador City (3.1 μg/m3), Thompson (3.3 μg/m3), and Grand Falls-Windsor (3.6 μg/m3).
While Vancouver, BC air quality meets annual pollution targets and fares relatively well compared to other cities in Canada, impacts to health can still occur. Stay current with Vancouver’s AQI data when air exceeds the recommended “good” standard, and follow air quality advisories to reduce health risk.
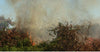
When will the smoke clear in Vancouver, BC?
Wildfires in North America’s west are getting worse. While fires play an important role in our planet’s natural landscape, scientists attribute the recent gains in wildfire prevalence and severity to anthropogenic climate change. Warming temperatures have brought earlier snowmelt, increased evaporation, greater water loss from vegetation, drier soils and an excess of forest undergrowth.3 Add fire, and wildfires have the propensity to rage hotter and longer than decades past.
This trend has been made frighteningly clear in just the last five years. 2017 was an unprecedented wildfire season both in terms of the acreage burned and severity of the resulting smoke. Just one year later, however, 2018 topped both measures, with a record 22 days of air quality advisories – 18 of which were related to wildfire smoke.
2020 is on pace to exceed the 2018 record for worst short term pollution as a result of wildfires, largely as a result of wind-blown smoke from wildfires burning in Washington State.
As temperatures continue to get hotter, and the climate gets drier, the impact of wildfires on air quality in British Columbia will grow, particularly during peak wildfire season from July to October. Take care to follow Vancouver’s forecast air quality data during these months to stay aware of pollution spikes and reduce your pollution exposure. Use the air quality map of British Columbia to understand where fires are burning and how they will affect regional air quality.
Why is air quality in Vancouver, BC bad?
Air quality in Vancouver primarily suffers from a combination of ozone and PM2.5 pollution. Both pollutants vary based on the season and often occur at different times.
PM2.5 describes suspended particles that measure 2.5 micrometers or smaller. This can include soot and ash from wildfires or wood stoves, chemicals from industrial complexes, the burning of fossil fuels in motor engines, and naturally occurring wind-blown dust.
PM2.5 is categorized by particle size rather than chemical composition like other air pollutants. This distinction is intentional. PM2.5 describes matter so small that it can often slip past the respiratory defense system and enter the blood-stream, causing far reaching health implications. Breathing PM2.5 has been connected to adverse health effects to the respiratory and cardiac systems, including shortness of breath and chest pain to chronic heart and lung diseases that contribute to early death.
Vancouver has daily PM2.5 emissions by way of gas-powered vehicular traffic, construction, and industry. The city’s highest PM2.5 levels, however, tend to result from wildfires and winter wood burning.
The summer of 2018 was the worst wildfire season on record in British Columbia. 1.35 million hectares of land were burned as more than 2,000 wildfires blazed through the province. This came just a year after record 2017 wildfires, which previously set the provincial record.
In order to forewarn residents of smoky conditions, B.C. shares Smoky Skies Bulletins. In 2018, Metro Vancouver air quality registered a total of 18 Smoky Skies Bulletins. Several monitoring sites in the area, including Prince George, Kelowna, Chilliwack, and Victoria, all hit their highest average concentrations over the past decade in 2018.
While often less prevalent at unhealthy concentrations, ozone is another key air pollutant of concern in Vancouver. Ozone is a highly irritating gas pollutant formed in the air from nitrogen dioxide (NO2) and volatile organic compounds (VOCs) reacting in sunlight. Since temperatures over 29 degrees Celsius are generally required for its formation, ozone typically occurs in the summer months during the afternoon hours and clears out in the evening.4
Recently, ozone levels have been influenced by wildfire smoke. 2015, 2017 and 2018 are believed to have experienced high ozone concentrations as a result of B.C. wildfires burning these years. 2018 experienced record wildfire smoke as well as the 4th highest daily 8-hour ozone concentrations.
Use IQAir’s air quality map to discover the location and severity of active fires in British Columbia and farther abroad. The map highlights the interaction of ambient particulate matter (PM2.5) and weather patterns, allowing users to track AQI (Air Quality Index) levels across the planet via vivid color-coded heat mapping.
How does Vancouver reduce air pollution?
The city of Vancouver strives to achieve the “cleanest air of any major city in the world.” For such a lofty goal, the city is not far off. Already, Vancouver averages cleaner air than cities of the same or greater population size.
In order to further drive down emissions, Vancouver and greater Canada are targeting the fossil fuel industry and gas-powered vehicles in particular. The federal government plans to invest more than $180 billion over 12 years in green infrastructure by expanding public transportation, the availability of electric vehicle (EV) power stations, and the share of cleaner and more efficient energy.5
By 2050, Canada hopes to have net-zero carbon emissions, meaning that any greenhouse gases produced would need to be offset.6 Currently, 70 percent of Canada’s energy is derived from fossil fuels. Achieving the 2050 goals will require all residents to transition to electric vehicles.
While drastic reductions in national emissions is on the horizon, unplanned wildfires remain a key threat to Vancouver’s air quality, and the air quality of greater British Columbia. Returning to the ancient practice of “prescribed” fires has recently gained traction. In the past, firefighting tactics have been successful, leading to an accumulation of forest undergrowth that may otherwise be cleared by natural fires. Prescribed fires offer an opportunity for firefighters to reduce the amount of fuel in forests by burning contained areas. Other options, which should be implemented together, include limiting development in fire sensitive areas and implementing measures to reduce the risk of human-caused wildfires.
+ Article Resources
[1] City of Vancouver. (2020). Clean air.
[2] BC Lung Association. (2020). 2019 State of the Air.
[3] Union of Concerned Scientists. (2020). The connection between climate change and wildfires.
[4] Current Results. (2020). Vancouver temperatures: averages by month.
[5] CBC News. (2020, September 1). Dozens of EV charging stations to be installed in northern, central B.C. and Vancouver Island.
[6] Johnson L. (2020, August 22). Net-zero emissions by 2050 is the goal. So how do we get there? CBC News.
Where is the cleanest air quality in Vancouver?
- Kerrisdale0
- South Vancouver2
- UBC2
- Kitsilano3
- Knight3
- The Tower on Frances3
- West 6th Avenue3
- BC Lung Foundation6
- David Lam Park6
- George Wainborn Park7
- Sea to Sky Network Solutions7
- Central Vancouver10
- Harbour Green16
- Canada Place17
- 36th Avenue26
- Almond Park27
- Harwood at Burrard27
- McSpadden Park27
- Yew Street - Connaught Park27
- Buckmaster Institute28
- Renfrew Street28