Air quality in Brussels
Air quality index (AQI⁺) and PM2.5 air pollution in Brussels • 271.5K Followers • 12:00, Jan 29 Local time
78
US AQI⁺Moderate

Main pollutant:
PM2.5
23.6 µg/m³
0°
7.4 km/h
92 %
Hourly forecast
Brussels air quality index (AQI⁺) forecast
Daily forecast
Brussels air quality index (AQI⁺) forecast
| Today | 71 | 3° 0° | 10.8 km/h | 91% | |
| Fri | 54 | 100% | 6° 0° | 25.2 km/h | 88% |
| Sat | 41 | 9° 4° | 25.2 km/h | 79% |
Air pollutants
What is the current air quality in Brussels?
PM2.5 concentration is currently 4.7 times the World Health Organization annual PM2.5 guideline value.

Health recommendations
Sensitive groups should reduce outdoor exercise |
Close your windows to avoid dirty outdoor air Get a monitor |
Sensitive groups should wear a mask outdoors Get a mask |
Sensitive groups should run an air purifier Get an air purifier |
Protect yourself from air pollution in Brussels
Shop IQAir productsWhen the air becomes a problem – we provide relief
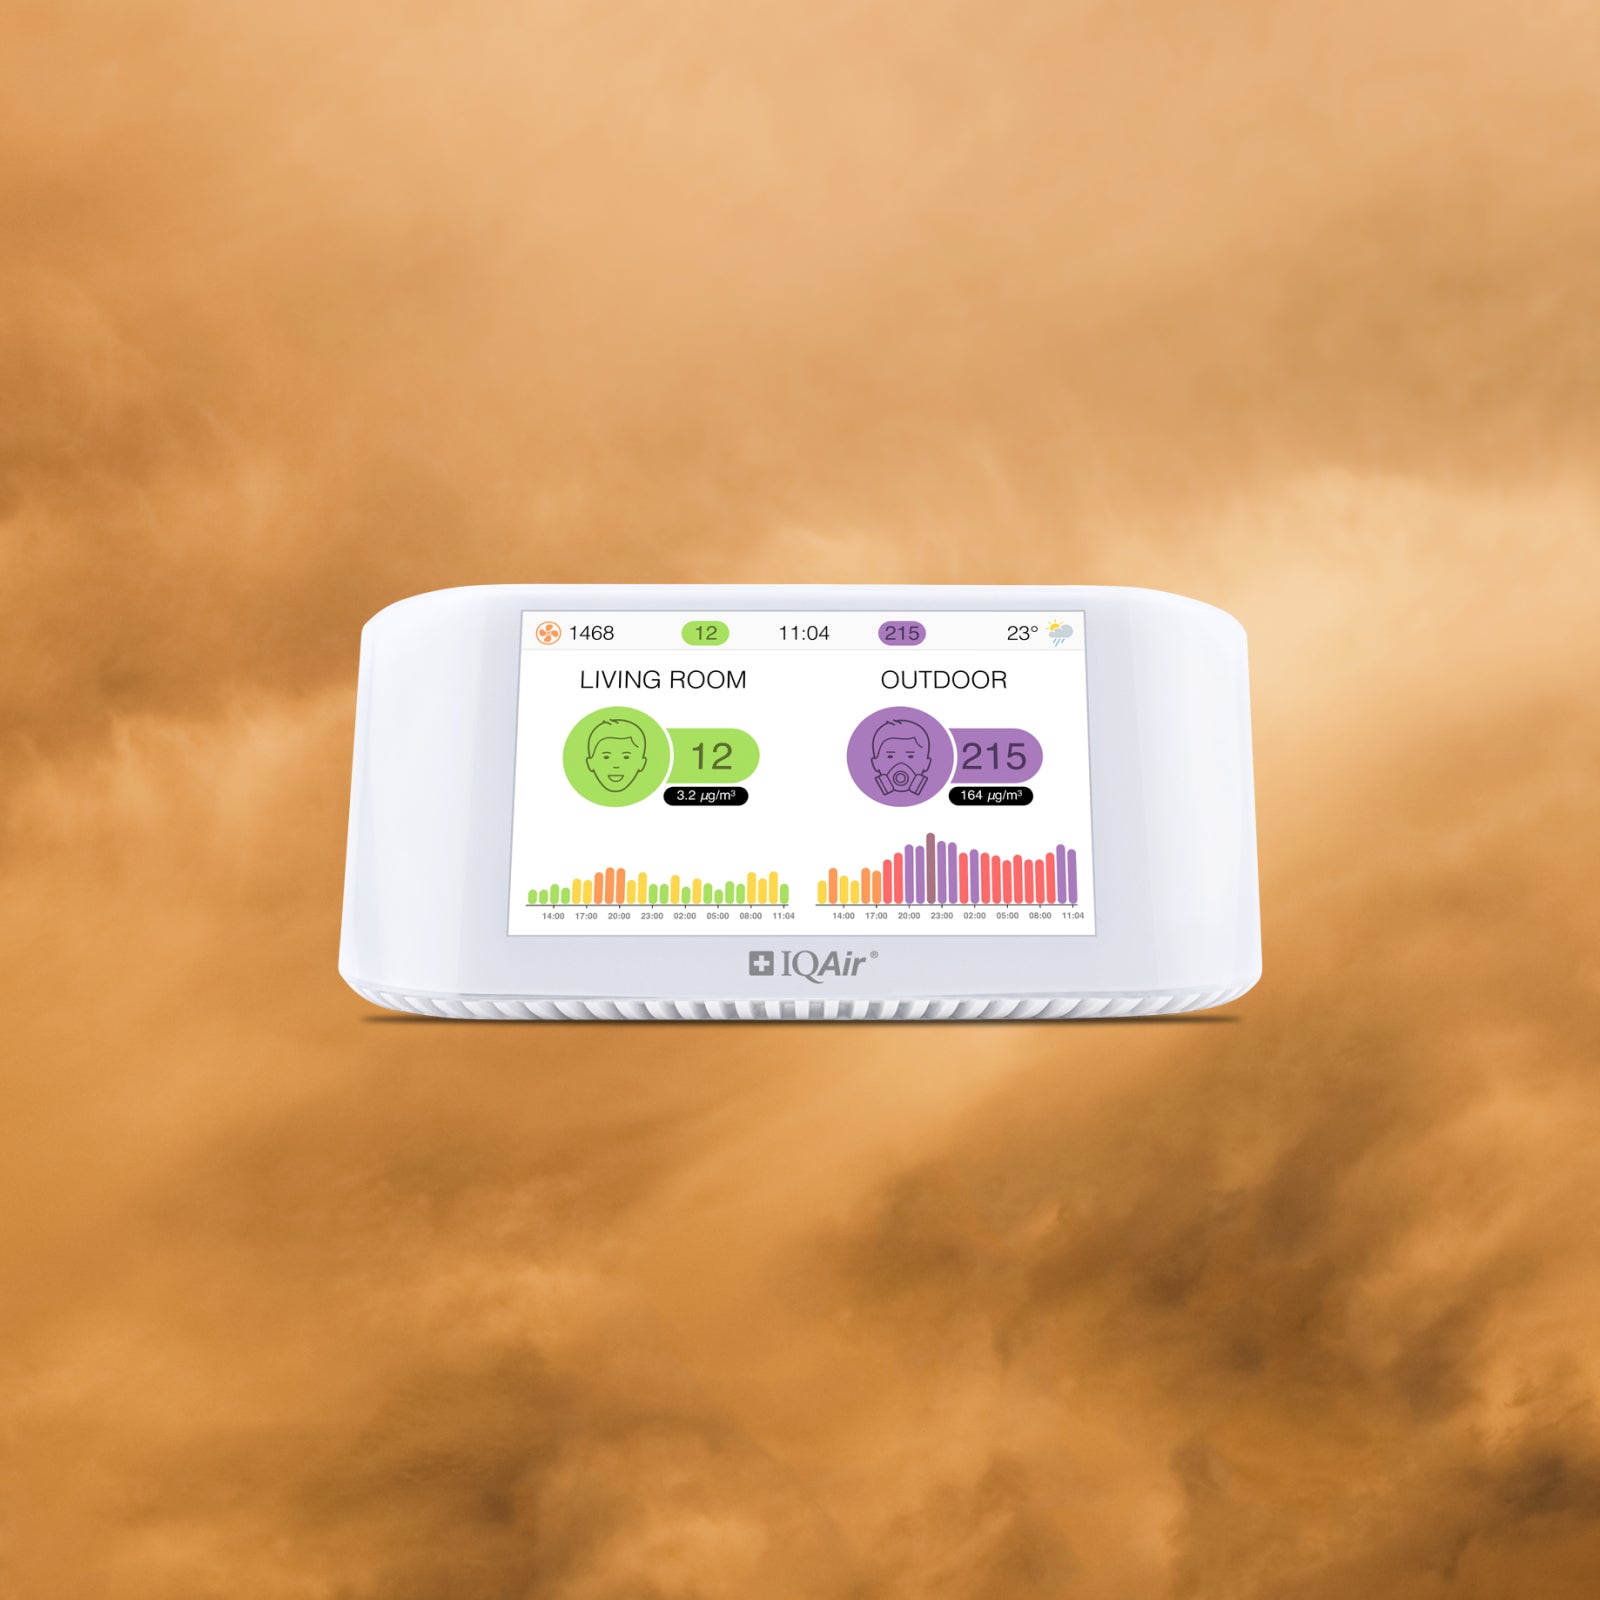
Monitor the air you breathe
Get accurate AirVisual air quality readings and real-time insights for cleaner air. Monitors that reveal pollution sources, highlight when air purifier use is needed.
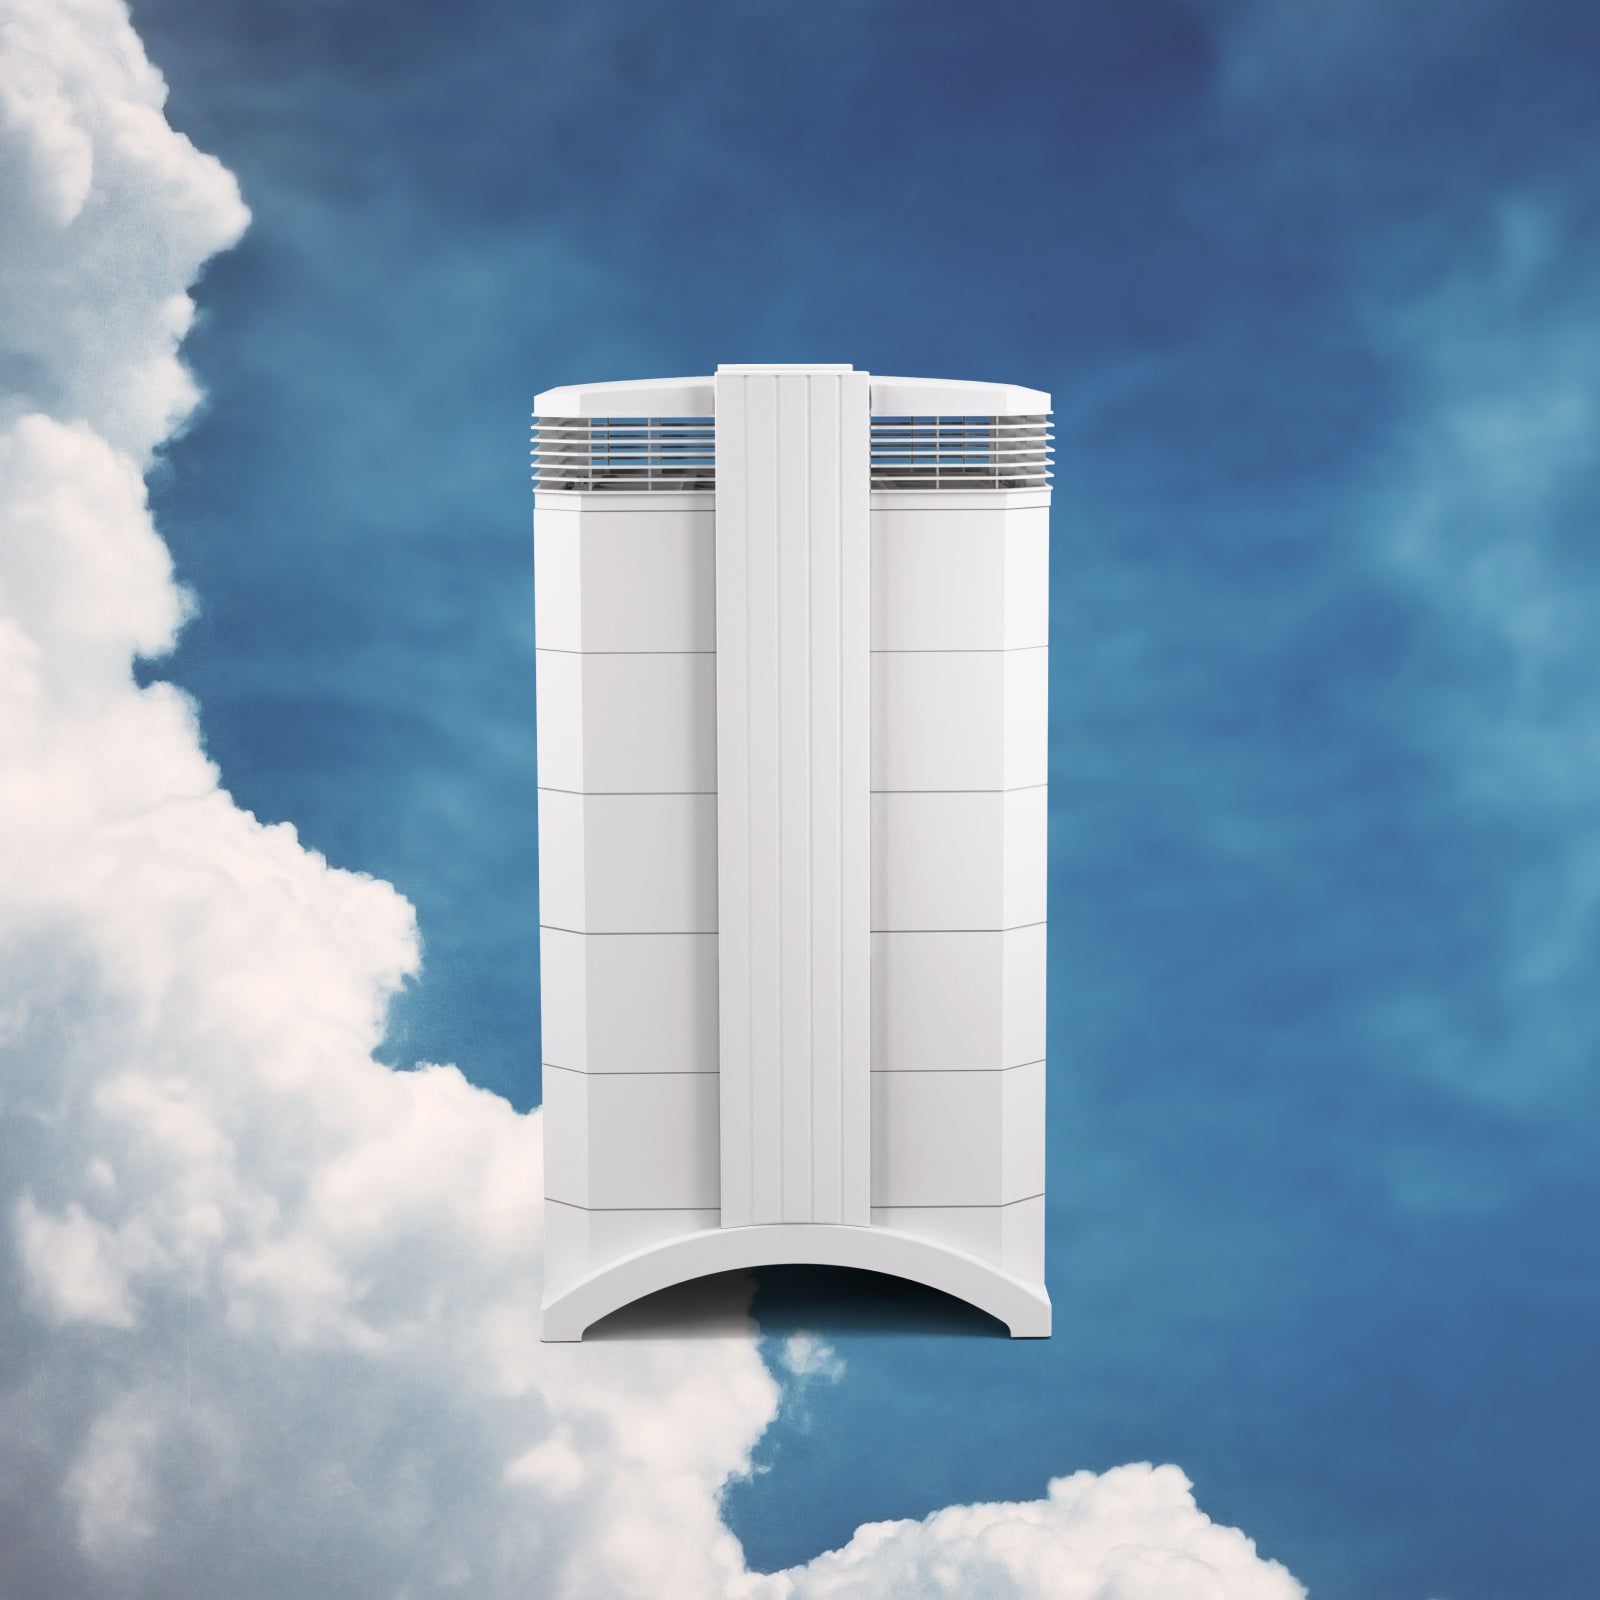
Medical grade air purifiers
Trusted worldwide, the HealthPro Series uses HyperHEPA technology. Filters ultrafine particles other air purifiers miss, delivering medical-grade protection.
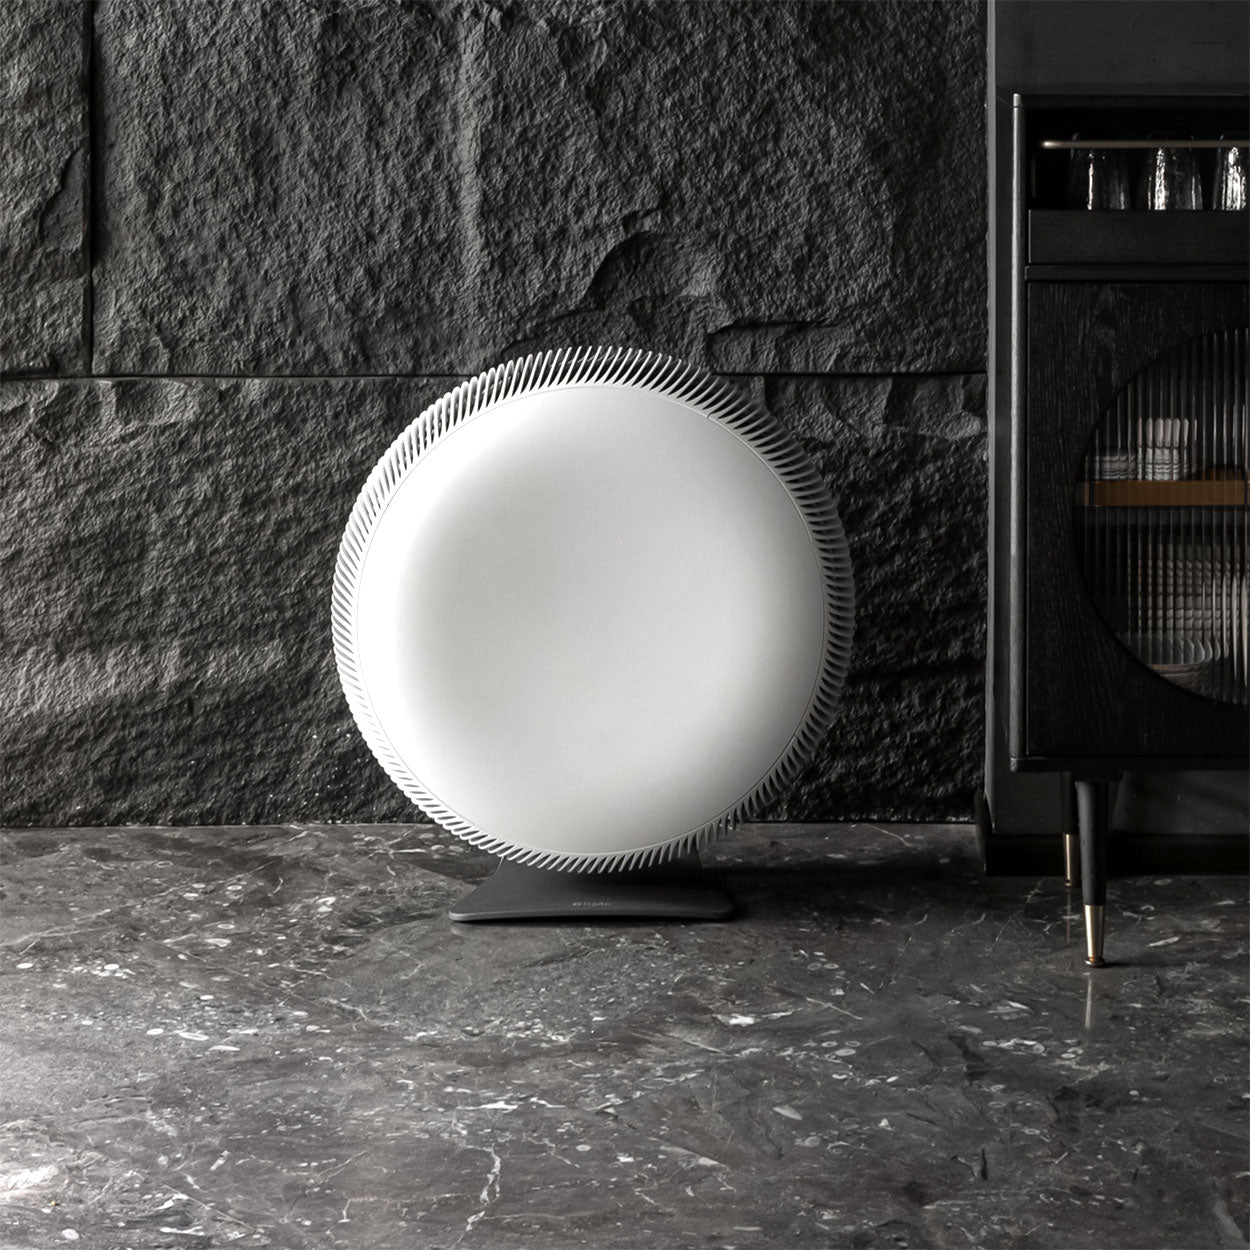
Powerful, stylish air purifiers
Compact and powerful, the Atem Series combines Swiss engineering with high-performance air purification, filtering ultrafine particles with HyperHEPA technology.
Pollen
What is the pollen count in Brussels today?
Index

None
Tree None | 0% |
Grass None | 0% |
Weed None | 0% |
Source:
Open-Meteo.comHealth recommendations
Sensitive groups should reduce outdoor exercise |
Close your windows to avoid dirty outdoor air Get a monitor |
Sensitive groups should wear a mask outdoors Get a mask |
Sensitive groups should run an air purifier Get an air purifier |
Pollen
What is the pollen count in Brussels today?
Index
None
Tree None | 0% |
Grass None | 0% |
Weed None | 0% |
Source:
Open-Meteo.comProtect yourself from air pollution in Brussels
Shop IQAir productsWhen the air becomes a problem – we provide relief
Monitor the air you breathe
Get accurate AirVisual air quality readings and real-time insights for cleaner air. Monitors that reveal pollution sources, highlight when air purifier use is needed.
Medical grade air purifiers
Trusted worldwide, the HealthPro Series uses HyperHEPA technology. Filters ultrafine particles other air purifiers miss, delivering medical-grade protection.
Powerful, stylish air purifiers
Compact and powerful, the Atem Series combines Swiss engineering with high-performance air purification, filtering ultrafine particles with HyperHEPA technology.
Most polluted locations near Brussels
Worldwide AQI⁺ rankingHistoric air quality near Brussels
History
Historic air quality graph for Brussels
Historic air quality near Brussels
History
Historic air quality graph for Brussels
Clean Air Facilities
Most polluted locations near Brussels
Worldwide AQI⁺ ranking


Measure your own air quality
Get a monitor and contribute air quality data in your city.
Learn more about air pollution in Brussels
What is the air quality index of Brussels?
Brussels, officially the Brussels-Capital Region is a region of Belgium comprising 19 municipalities, including the City of Brussels, which is the capital of Belgium. It is located in the central part of Belgium and is part of the French and also the Flemish sectors. Brussels is a major centre for many international organisations, most notably, it is the de facto capital of the European Union.
In early 2021, Brussels was experiencing a period of “Moderate” quality air with a US AQI reading of 63. This classification is based on recommendations by the World Health Organisation (WHO). The concentrations of the measured pollutants were: PM2.5 - 18 µg/m³, ozone (O3) - 55 µg/m³ and nitrogen dioxide (NO2) - 11 µg/m³. With levels such as these, the advice is to close doors and window to prevent the ingress of dirty air into the rooms and those of a sensitive disposition should avoid outdoor activity until the air quality improves.
What is the main source of air pollution in Brussels?
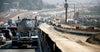
There are two four-lane highways through which traffic stops at all times. In traffic jams, you can also walk down the side streets of the area. There are simply far too many cars. Emissions from vehicles are the main source of air pollution in Brussels.
In Brussels, in addition to fine particles of PM2.5, the problem is nitrogen oxide (NOx) emissions. Both are constantly in the air many times the permitted values.
On the Arts-Loi Street across the EU, the average concentration of nitrogen oxides in the air is 56 micrograms per cubic meter µg/m³. On many days, the concentration rises alarmimgly. The maximum permissible concentration according to EU law is 40 µg/m³.
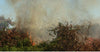
The most dangerous air pollutants for humans are respirable particles (PM10), fine particles (PM2.5), nitrogen dioxide (NO2) and ground-level ozone (O3). According to the European Environment Agency, the biggest sources of air pollution in EU countries are domestic heating, road transport, energy production, industry and agriculture. In cities, one of the worst sources of air pollution is traffic.
What is the pollution level in Brussels?
Looking back at figures from 2019, it can be seen that in September of that year, Brussels attained the target air quality figure of less than 10 µg/m³. During the months of July and December, the air quality was “Good” with figures between 10 and 12 µg/m³. For the remaining 9 months, the air quality was “Moderate” with figures between 12.1 and 35.4 µg/m³. Looking back over previous years it can be seen that the air quality does not change very much. In 2017 the figure was 14.9 µg/m³ and in 2018 it was 14.1 µg/m³. The average for 2019 was also 14.1 µg/m³.
What can be done to improve the air quality in Brussels?
Belgium celebrated its annual car-free day. The day is truly car-free in Belgium. From morning to evening, motoring is prohibited within the entire Brussels-Capital Region, which covers 19 municipalities. The ban does not apply to public transport, the use of which is free of charge on a car-free day.
The streets of the city this year were also full of events from organic markets and concerts to pony rides.
The 2008 Air Quality Directive is a keystone of EU air quality policy, as it sets acceptable levels for concentrations of air pollutants. The directive also requires member states to analyse air quality and report the results to the European Environment Agency, as well as to draw up national plans for improving air quality.
The EU Commission also has the power to take action if the Member States do not comply with the requirements of the directive but, for example, breach the limit values for air pollution.
Much has already been achieved as a result of the regulations. People no longer have to breathe sulphur dioxide, lead, leukaemia-causing benzene, carbon dioxide or carbon monoxide.
In many countries, there is a need to address household heating with solid fuels. In addition to wood, coal is also used in many EU countries. The key means of transport are the old familiar promotion of walking, cycling, low-emission passenger cars and public transport, for example through infrastructure development and public procurement.
Traffic is currently being electrified. Car manufacturers have started to produce new electric car models and prices are falling so that hopefully the average consumer will be able to afford it. The next thing is that the local councils must provide convenient recharging points throughout the city. Drivers of electric vehicles need to know they can be recharged if needed. Without such facilities, there will be no confidence in owning such a vehicle because it would be a liability.
Emission limits for nitrogen oxides, particulate emissions, carbon monoxide and hydrocarbons have been defined for cars, vans and trucks through Euro standards. In addition, a maximum emission value has been set for greenhouse gas carbon dioxide from 2012 onwards. It has long been known that car emissions are in fact up to seven times higher than measurements made under laboratory conditions suggest.
The European Commission, therefore, intends to include RDE emissions in mandatory calculations, i.e. emissions from real driving conditions. Therefore, in addition to Euro standards, all new cars should remain within the RDE limits. From 2017 onwards, this regulation applies to the nitrogen oxide values for diesel cars and the fine particulate matter (PM) values for all cars.
Diesel pollutants are also released into the city air from various work machines, the emission limit values of which should also be tightened.
What are the effects of breathing Brussels’ poor quality air?
Air pollution from particulate matter PM2.5 and PM10, nitrogen dioxide (NO2) and ground-level ozone (O3) is the leading cause of premature deaths in Europe. According to statistics from the European Environment Agency, air pollution causes 422,000 premature deaths in EU countries every year. By comparison, about 25,000 people die in road accidents every year.
Air pollutants directly cause chronic and serious diseases such as asthma, cardiovascular disease and cancer. According to studies, polluted air is also a component in the onset of type 2 diabetes, childhood obesity and Alzheimer's disease.