Air quality in Chengdu
Air quality index (AQI⁺) and PM2.5 air pollution in Chengdu • 2.3M Followers • 19:00, Jan 29 Local time
122
US AQI⁺Unhealthy for sensitive groups

Main pollutant:
PM2.5
44 µg/m³
10°
18 km/h
62 %
Hourly forecast
Chengdu air quality index (AQI⁺) forecast
Daily forecast
Chengdu air quality index (AQI⁺) forecast
| Today | 132 | 12° 8° | 7.2 km/h | 54% | |
| Fri | 131 | 11° 6° | 7.2 km/h | 65% | |
| Sat | 127 | 12° 4° | 10.8 km/h | 47% |
Air pollutants
What is the current air quality in Chengdu?
PM2.5 concentration is currently 8.8 times the World Health Organization annual PM2.5 guideline value.

Health recommendations
Reduce outdoor exercise |
Close your windows to avoid dirty outdoor air Get a monitor |
Sensitive groups should wear a mask outdoors Get a mask |
Run an air purifier Get an air purifier |
Protect yourself from air pollution in Chengdu
Shop IQAir productsWhen the air becomes a problem – we provide relief
Monitor the air you breathe
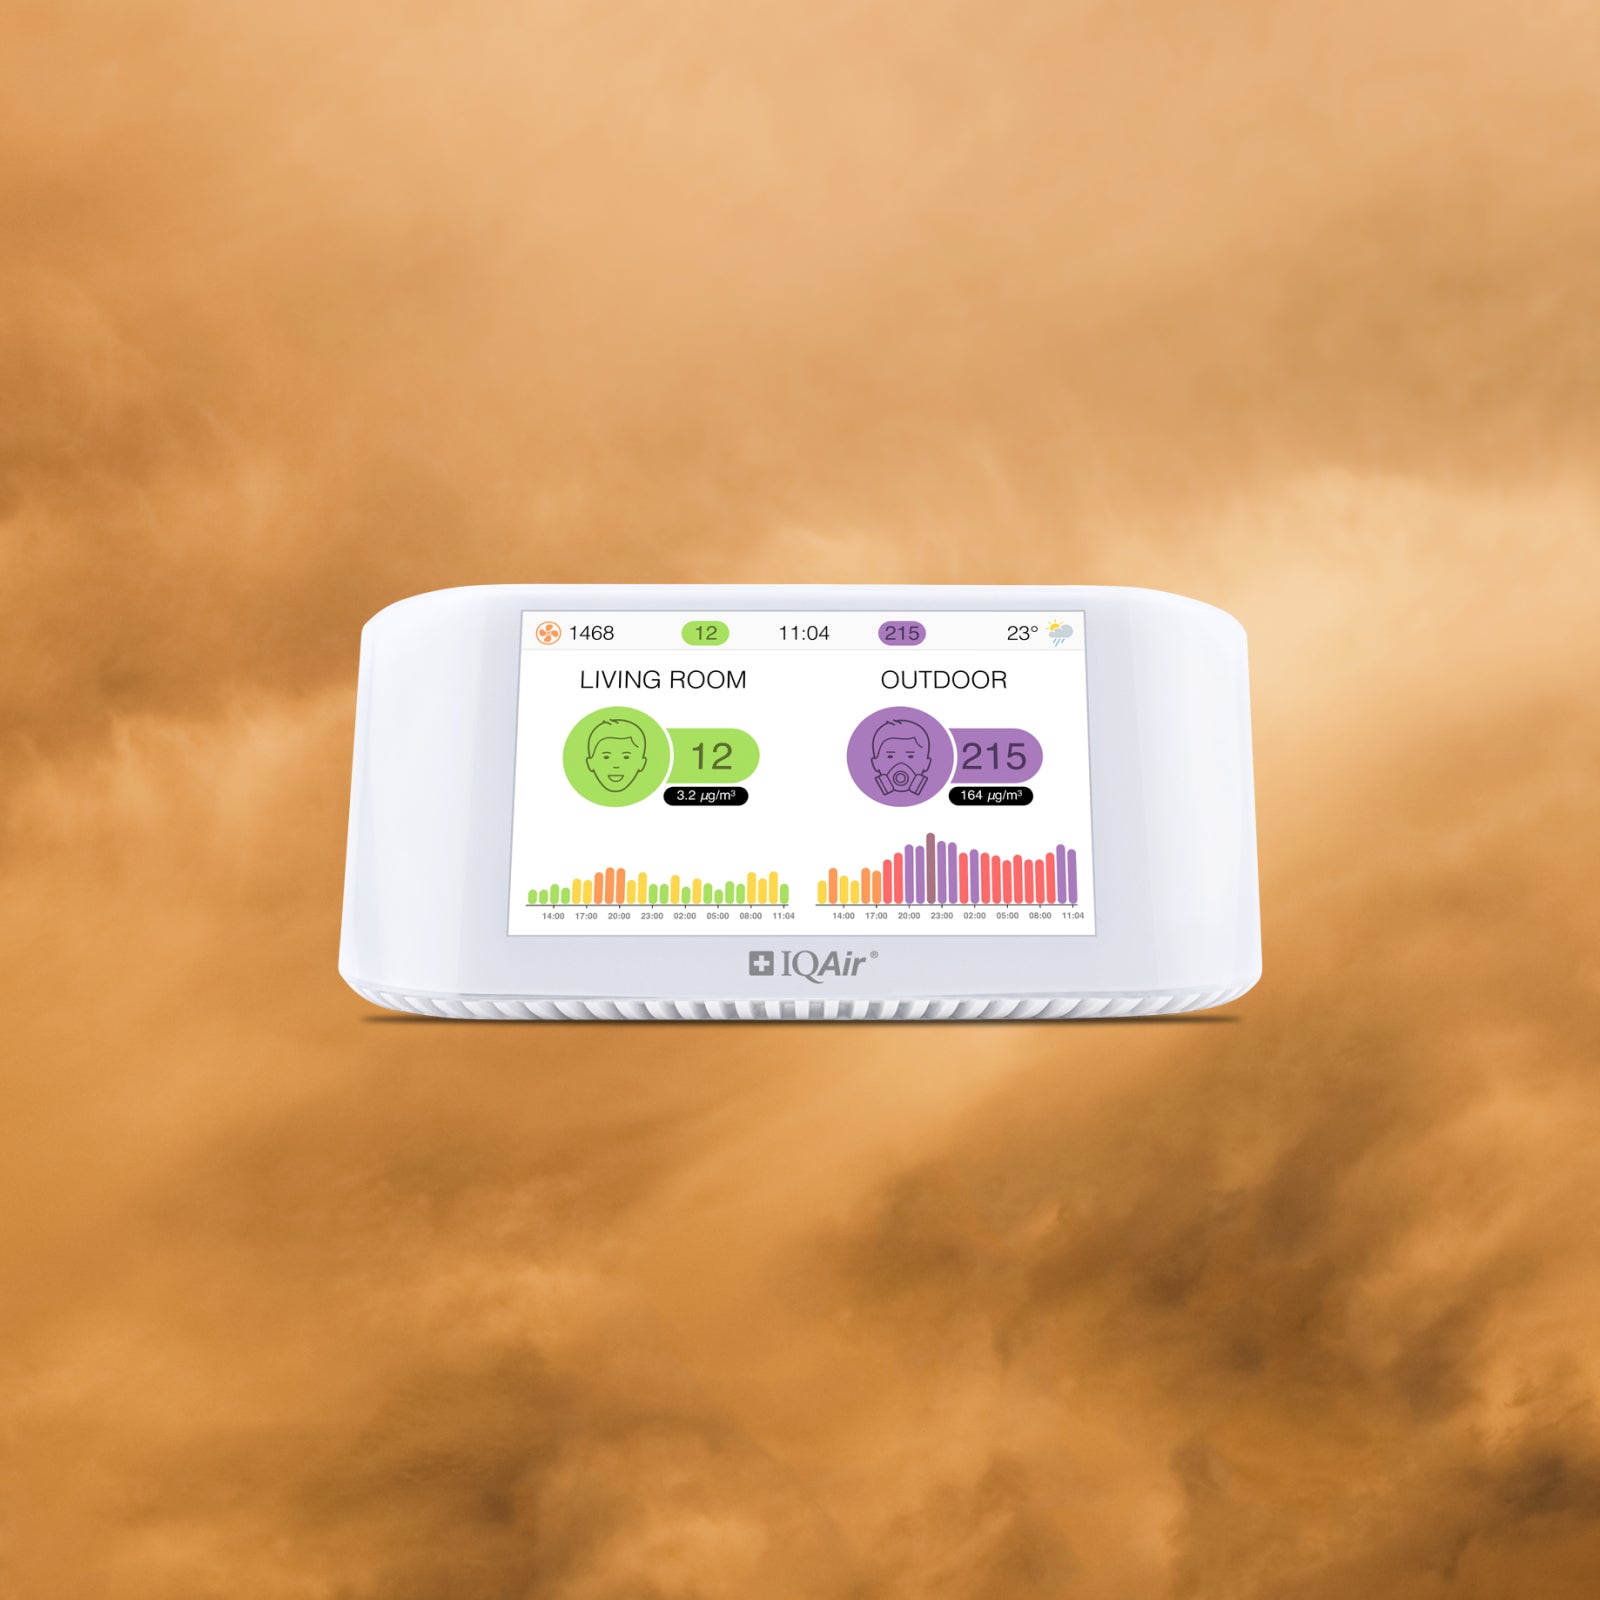
Get accurate AirVisual air quality readings and real-time insights for cleaner air. Monitors that reveal pollution sources, highlight when air purifier use is needed.
Medical grade air purifiers
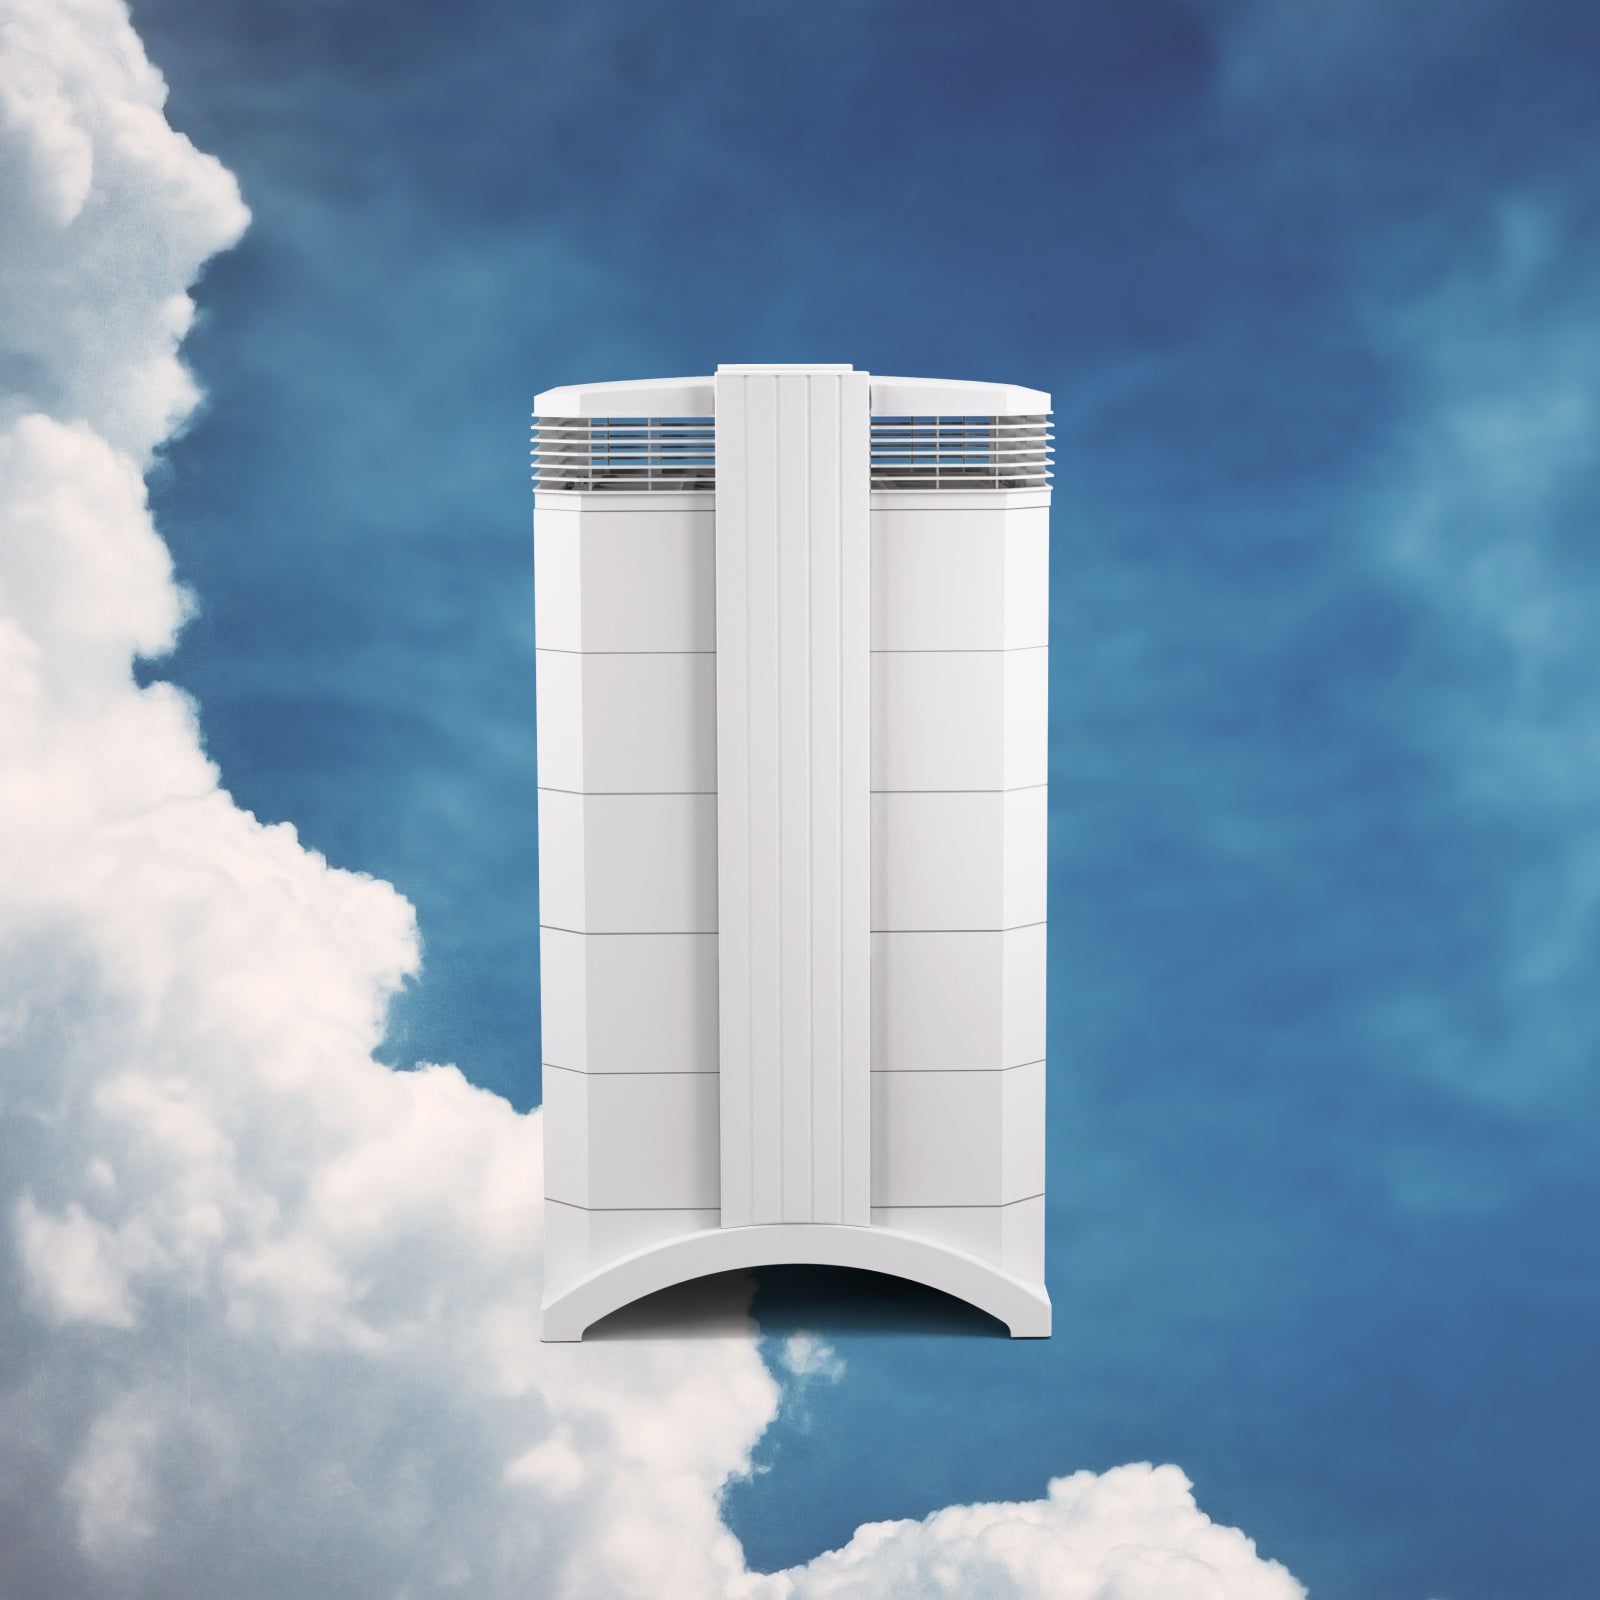
Trusted worldwide, the HealthPro Series uses HyperHEPA technology. Filters ultrafine particles other air purifiers miss, delivering medical-grade protection.
Powerful, stylish air purifiers
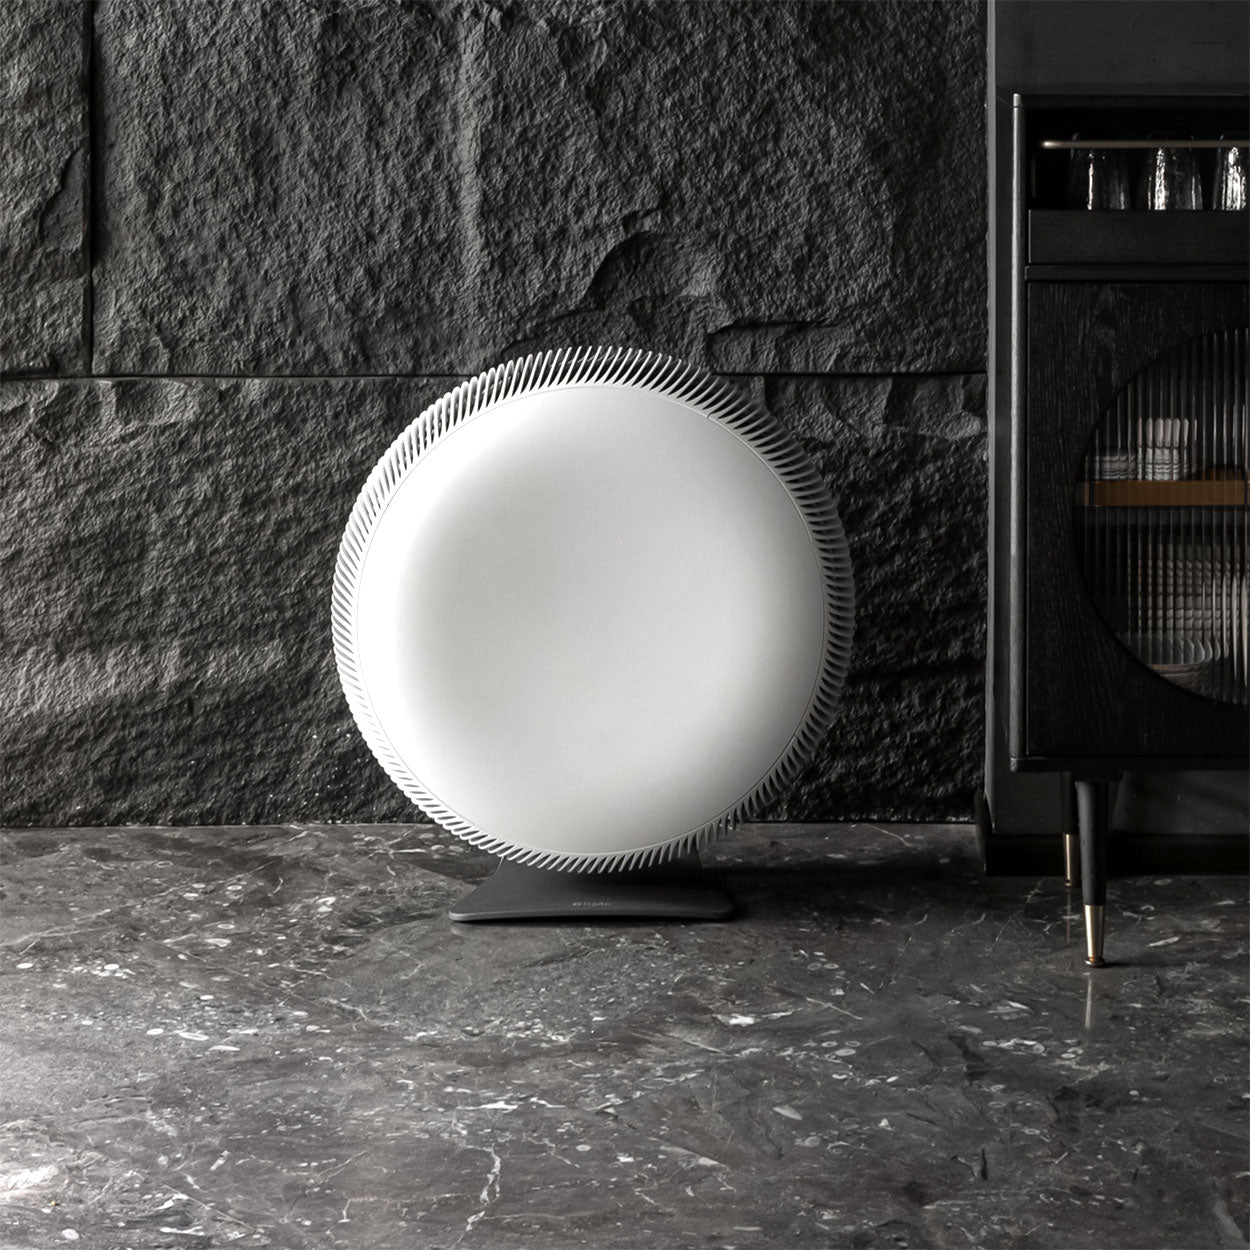
Compact and powerful, the Atem Series combines Swiss engineering with high-performance air purification, filtering ultrafine particles with HyperHEPA technology.
Allergy forecasts
Today
天气条件极不易诱发过敏。
Friday
Saturday
Source:
weather.com.cnHealth recommendations
Reduce outdoor exercise |
Close your windows to avoid dirty outdoor air Get a monitor |
Sensitive groups should wear a mask outdoors Get a mask |
Run an air purifier Get an air purifier |
Allergy forecasts
Today
天气条件极不易诱发过敏。
Friday
Saturday
Source:
weather.com.cnProtect yourself from air pollution in Chengdu
Shop IQAir productsWhen the air becomes a problem – we provide relief
Monitor the air you breathe
Get accurate AirVisual air quality readings and real-time insights for cleaner air. Monitors that reveal pollution sources, highlight when air purifier use is needed.
Medical grade air purifiers
Trusted worldwide, the HealthPro Series uses HyperHEPA technology. Filters ultrafine particles other air purifiers miss, delivering medical-grade protection.
Powerful, stylish air purifiers
Compact and powerful, the Atem Series combines Swiss engineering with high-performance air purification, filtering ultrafine particles with HyperHEPA technology.
Most polluted locations near Chengdu
Worldwide AQI⁺ rankingStation ranking
Real-time China AQI⁺ station ranking
Historic air quality near Chengdu
History
Historic air quality graph for Chengdu
Historic air quality near Chengdu
History
Historic air quality graph for Chengdu
Clean Air Facilities
Most polluted locations near Chengdu
Worldwide AQI⁺ rankingStation ranking
Real-time China AQI⁺ station ranking


Measure your own air quality
Get a monitor and contribute air quality data in your city.
Learn more about air pollution in Chengdu
What are the main causes of pollution In Chengdu?
Like many cities in China, Chengdu suffers from the same pollutive issues that afflicts cities undergoing rapid development, with large amounts of rural to urban migration still occurring, and massive changes having occurred in many cities throughout China over the last two decades.
Among the main causes would be prominent ones such as fumes and emissions from vehicles. With a population of some 16.3 million people, there would be a huge amount of accompanying cars and motorbikes, as well as heavy duty vehicles such as trucks, lorries and buses.
The amounts of personal cars in Chengdu have shot up over the last few years, with estimates of vehicle counts increasing by some 20 thousand a month in 2011. At the same time, due to its geographical location in Sichuan basin, Chengdu is subject to lesser amounts of wind as well as higher humidity levels, thus allowing smoke and haze given off from vehicles to accumulate within the cities air, unable to disperse.
Other prominent causes of pollution would be the industrial sector, with numerous factories across the cities limits working at high capacity, often running on fossil fuels such as coal, which puts out enormous amounts of chemical pollutants as well as fine particulate matter. These would be the two compounding factors for pollution in Chengdu.
When is pollution at its worst in Chengdu?
Observing the data taken over 2019, Chengdu came in with its worst readings of pollution in the beginning portion of the year, as well as at the very end, showing that from year to year, Chengdu would have its descent into poor levels of air quality hit a peak in December, which would continue into the next year before gradually abating in March, and dropping further from then on out till it reached the end of the year spike again.
With the data available, the most polluted months in order were December, January and February, with PM2.5 readings of 77.1 μg/m³, 76.6 μg/m³ and 55.7 μg/m³ respectively.
These readings placed all of these months into the ‘unhealthy’ ratings bracket, which as the name implies is highly detrimental for those caught in the city during these times, particularly in the areas where the pollution tends to emanate from, such as areas of high traffic as well as industrial zones. Being put into the unhealthy ratings bracket requires a PM2.5 reading of anywhere between 55.5 to 150.4 μg/m³ to be classified as such, a number that is very high indeed and would come with a vast amounts of detrimental health effects.
When is Chengdu's air at its cleanest?
Following from the previous question, after the aforementioned spikes in PM2.5 start to subside in March, the air from there on out is at its cleanest, until November comes around and the pollution levels once again begin to rise.
To quote some figures, March came in with a PM2.5 reading of 44 μg/m³, a fair drop from Februarys reading of 55.7 μg/m³. Such large discrepancies between different months of the year is often a great cause for concern, indicating that seasonal pollution problems can cause mortality rates to soar and be of great detriment to a country’s citizens and economy.
May through to October all had the cleanest readings, within the ‘moderate’ ratings bracket, with June, July and August being the best of the year, with readings of 24 μg/m³, 22.5 μg/m³ and 28.2 μg/m³ respectively. This puts July at the cleanest month out of the entire year.
What are some of the main pollutants in Chengdu?
With much of its pollution arising from vehicular emissions as well as factory effluence and coal burning, the pollutants in Chengdu's air would contain a vast array of dangerous compounds and particulate matters. Some of these would include ones such as nitrogen dioxide and sulfur dioxide, both of which are released from vehicle engines, as well as the incomplete combustion of fossil fuels such as coal, so they would both be present in areas that see large amounts of traffic as well as industrial sites.
Nitrogen dioxide is the more prominent one due to its massive release from vehicles, so much so to the point that the amount of pollution in any area can be quantified on how much is being caused by vehicles alone judging by the amount of nitrogen dioxide in the air, directly correlating with high volumes of traffic.
Pollutants such as this are known to trigger off aggravated asthma attacks, as well as causing damage to the lungs and heart. Other pollutants would be PM2.5 and PM10’s such as black carbon, a major component in soot, as well as volatile organic compounds (VOC’s) such as benzene, toluene, formaldehyde and tetrachloroethylene, all of which are highly detrimental to human health and the environment.