Air quality in Kolkata
Air quality index (AQI⁺) and PM2.5 air pollution in Kolkata • 1.6M Followers • 16:30, Jan 29 Local time
169
US AQI⁺Unhealthy

Main pollutant:
PM2.5
81.5 µg/m³
26°
14.8 km/h
39 %
Hourly forecast
Kolkata air quality index (AQI⁺) forecast
Daily forecast
Kolkata air quality index (AQI⁺) forecast
| Today | 177 | 28° 18° | 10.8 km/h | 34% | |
| Fri | 167 | 29° 18° | 10.8 km/h | 34% | |
| Sat | 165 | 30° 18° | 10.8 km/h | 26% |
Air pollutants
What is the current air quality in Kolkata?
PM2.5 concentration is currently 16.3 times the World Health Organization annual PM2.5 guideline value.

Health recommendations
Avoid outdoor exercise |
Close your windows to avoid dirty outdoor air Get a monitor |
Wear a mask outdoors Get a mask |
Run an air purifier Get an air purifier |
Protect yourself from air pollution in Kolkata
Shop IQAir productsWhen the air becomes a problem – we provide relief
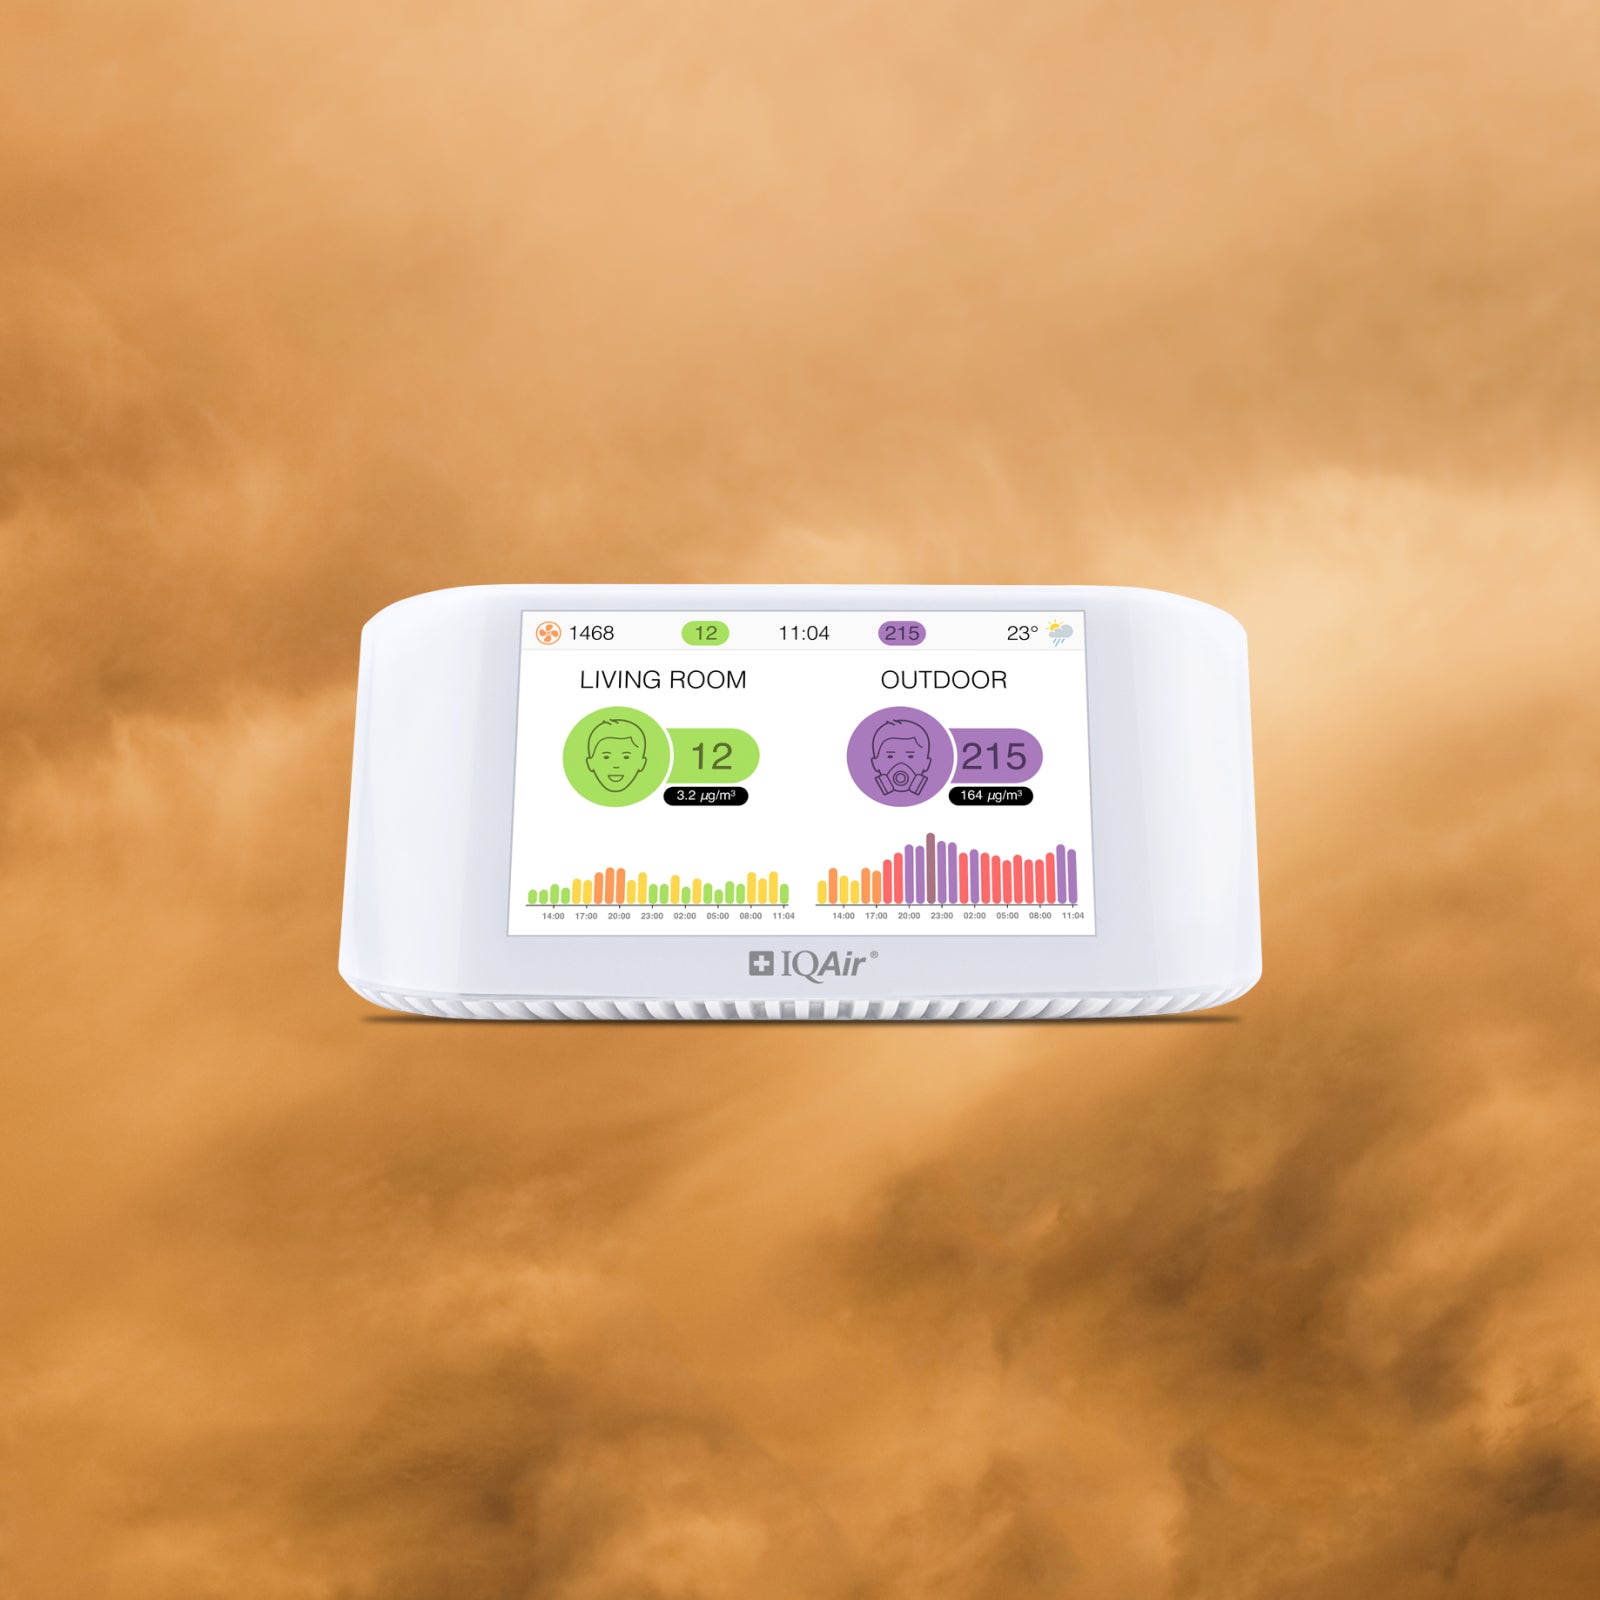
Monitor the air you breathe
Get accurate AirVisual air quality readings and real-time insights for cleaner air. Monitors that reveal pollution sources, highlight when air purifier use is needed.
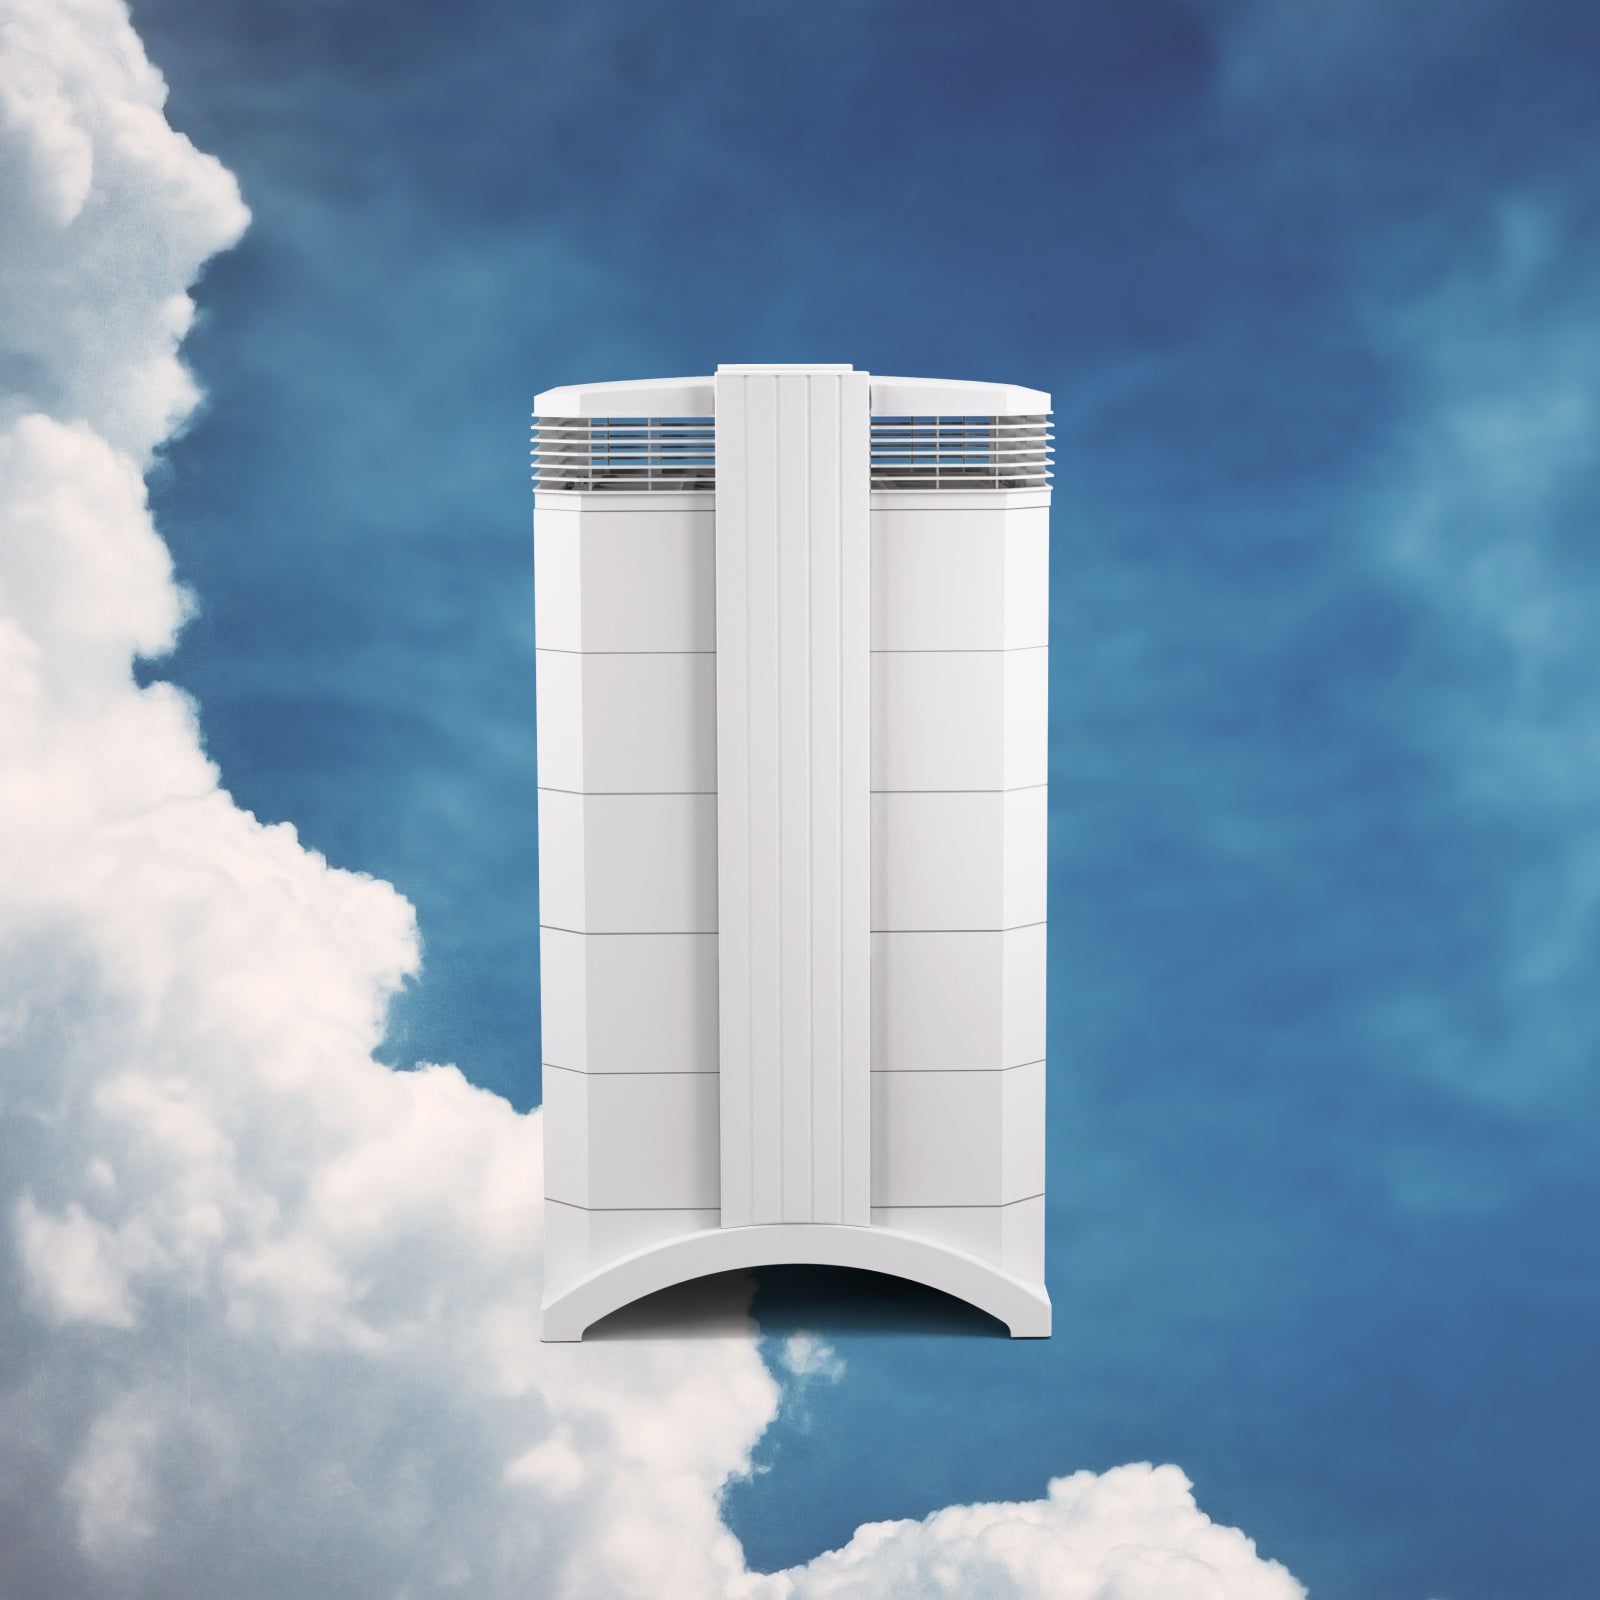
Medical grade air purifiers
Trusted worldwide, the HealthPro Series uses HyperHEPA technology. Filters ultrafine particles other air purifiers miss, delivering medical-grade protection.
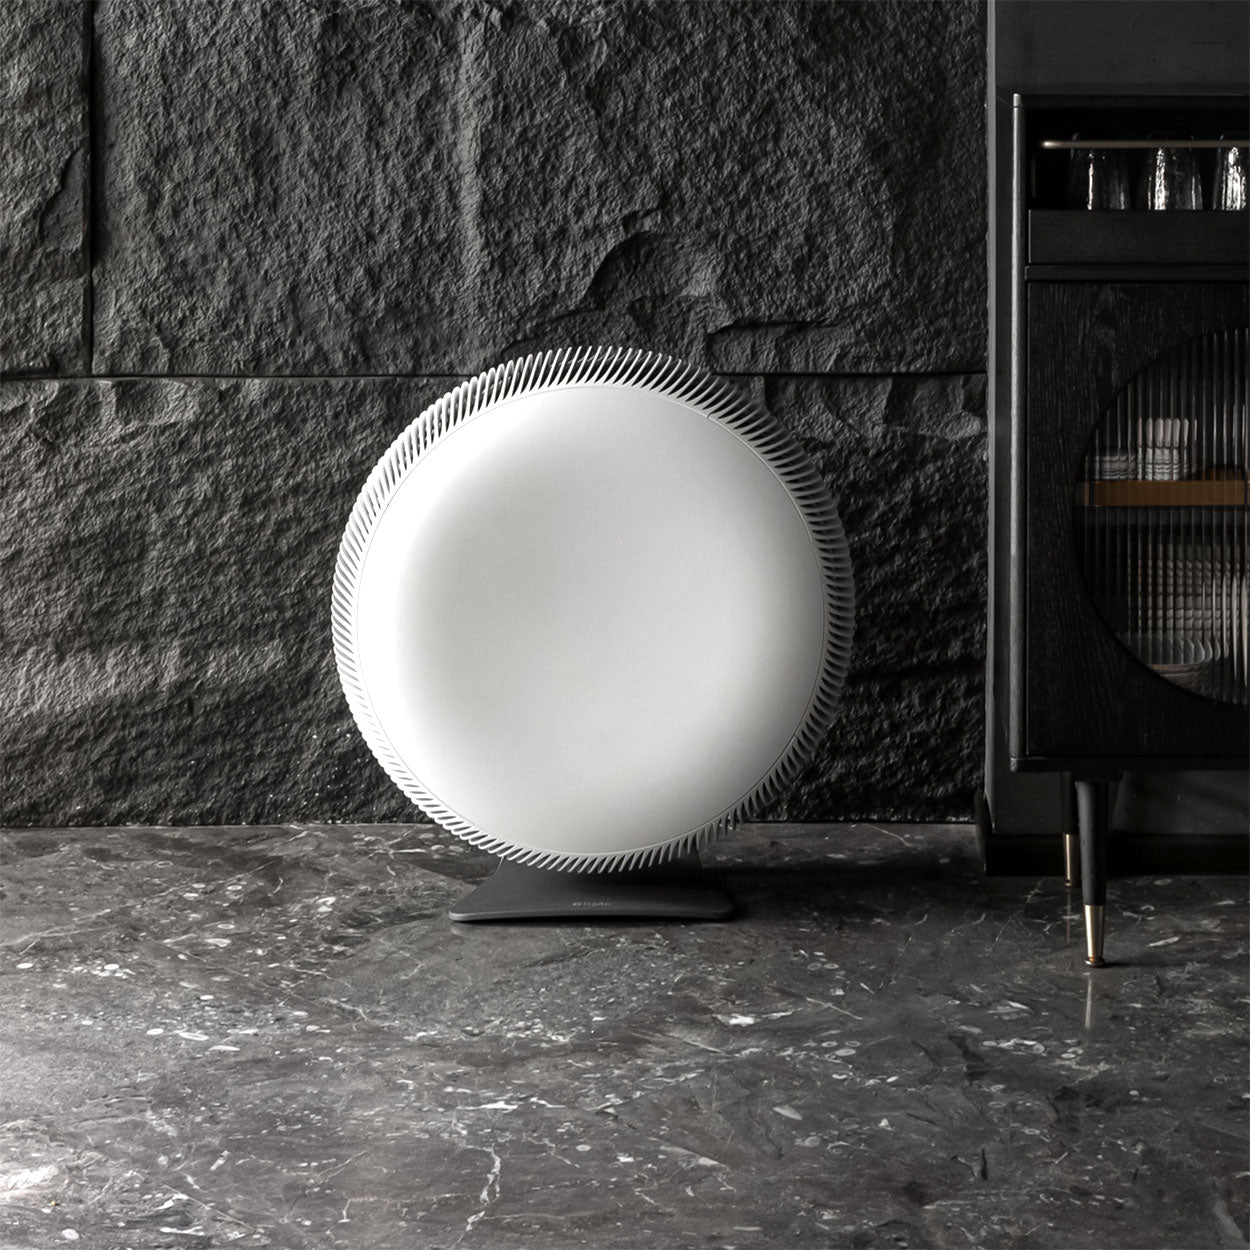
Powerful, stylish air purifiers
Compact and powerful, the Atem Series combines Swiss engineering with high-performance air purification, filtering ultrafine particles with HyperHEPA technology.

Health recommendations
Avoid outdoor exercise |
Close your windows to avoid dirty outdoor air Get a monitor |
Wear a mask outdoors Get a mask |
Run an air purifier Get an air purifier |
Protect yourself from air pollution in Kolkata
Shop IQAir productsWhen the air becomes a problem – we provide relief
Monitor the air you breathe
Get accurate AirVisual air quality readings and real-time insights for cleaner air. Monitors that reveal pollution sources, highlight when air purifier use is needed.
Medical grade air purifiers
Trusted worldwide, the HealthPro Series uses HyperHEPA technology. Filters ultrafine particles other air purifiers miss, delivering medical-grade protection.
Powerful, stylish air purifiers
Compact and powerful, the Atem Series combines Swiss engineering with high-performance air purification, filtering ultrafine particles with HyperHEPA technology.
Most polluted locations near Kolkata
Worldwide AQI⁺ rankingStation ranking
Real-time India AQI⁺ station ranking
City ranking
Real-time India AQI⁺ city ranking
Historic air quality near Kolkata
History
Historic air quality graph for Kolkata
Historic air quality near Kolkata
History
Historic air quality graph for Kolkata
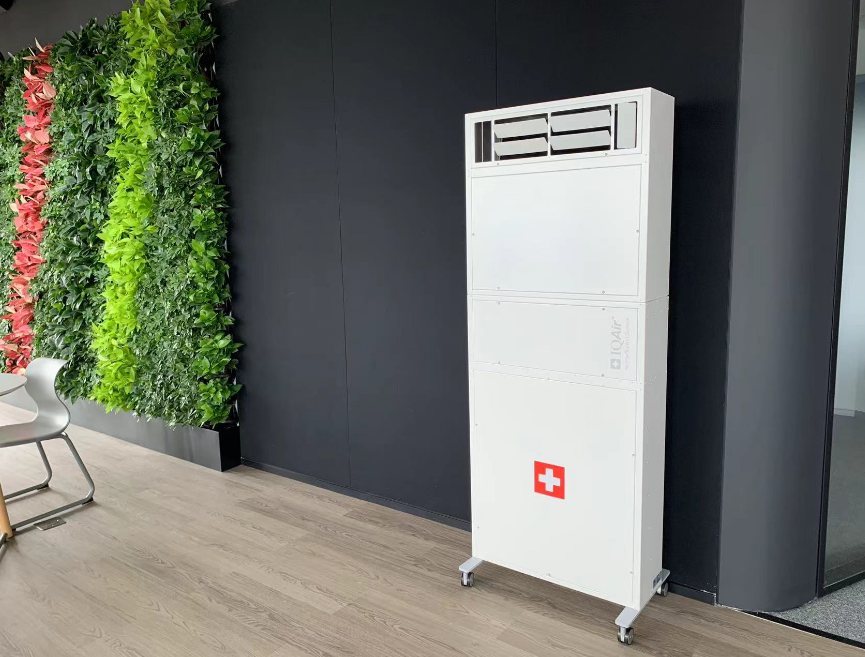
Clean Air Facilities
Most polluted locations near Kolkata
Worldwide AQI⁺ rankingStation ranking
Real-time India AQI⁺ station ranking
City ranking
Real-time India AQI⁺ city ranking


Measure your own air quality
Get a monitor and contribute air quality data in your city.


Learn more about air pollution in Kolkata
How polluted is the city of Kolkata?
Kolkata, sometimes known as the city of joy, is located approximately 80km away from the border to Bangladesh, and is the capital city of the Indian state of Bengal. Famous for its long history of culture, commerce as well as literary and artistic thought, it attracts many visitors, both internationally and locally, as well as having a rapidly growing and somewhat large population of inhabitants, some four and a half million as recorded in 2011, and with 14.85 million as of 2020, showing massive growth not only economically but in regards to the amount of people living within the megacity limits.
Kolkata was shown to have a PM2.5 reading of 59.8 as recorded in 2019, as a yearly average. This puts it directly into the ‘unhealthy’ bracket rating, which requires a PM2.5 reading of anywhere between 55.5 to 150.4 μg/m³ to be classified as such. This reading places it in the position of 61st most polluted city worldwide in 2019, and coming in at 28th place out of all cities ranked in India. This shows that Kolkata is indeed very polluted, and whilst it may not suffer from the same extreme levels of pollution that other cities do, it certainly has many months that see very hazardous levels of pollution.
When is pollution at its worst in Kolkata?
Observing the data recorded over 2019, the one month that stood out above all others was January, which came in with a PM2.5 reading of 176.1 μg/m³, putting it squarely into the ‘very unhealthy’ bracket, one which requires a reading of any PM2.5 number between 150.5 μg/m³ and 250.4 μg/m³ to be given such a title.
PM2.5 (and its larger cousin, PM10) refers to fine particulate matter that is 2.5 or less micrometers in diameter, or 10 if referring to PM10, which is somewhat less deadly due to its larger size but still has the ability to cause many issues when inhaled over long periods of time.
With a rating of 176.1 μg/m³ in January, the whole population would be at a very large risk of adverse health effects, with young children, the elderly and those with predisposition to being sick at highest risk. To give some comparison, the cleanest month recorded in Kolkata was 19.7 μg/m³, nearly 9 times lower than the highest months reading. The disparity is somewhat alarming, with some serious causes being behind this large spike of pollution.
What are the main causes of pollution in Kolkata?
The main causes of pollution in Kolkata would be similar to many other states and cities in India, although with differences in what times of the year see their worst spikes in smoke and haze, due to several different factors. Vehicles always play a large role in the ambient year-round pollution levels, with highly dense and populated cities often playing host to an equal, if not a greater number of vehicles. Cars and motorbikes as well as lorries and trucks would all be emitting vast quantities of smoke, haze and pollution into the air, with ones running off of fossil fuels such as diesel putting out larger amounts of pollution.
Pollutants arising from the vehicular industry would include black carbon and volatile organic compounds (VOC’s), both of which are released from the incomplete combustion of fossil fuels such as diesel.
They are also produced from practices such as slash and burn farming, setting organic waste and refuse on fire, as well as the use of coal to provide power to the numerous factories and industrial plants located around Kolkata. The main pollutant released from the vehicular industry (as well as from all combustion sources) would be nitrogen dioxide (NO2), which is found in high concentration around any area worldwide that sees high volumes of traffic, and indeed Kolkata would be no exception, with levels of nitrogen dioxide constantly being a looming threat in its rise, due to the population explosion and therefore rise in personal vehicles.
What is Kolkata doing about its pollution levels?
Kolkata is implementing a number of incentives over the last few years out of growing concern for its pollution levels. A large amount of resources have been poured into the public transport sector, which would go a long way to helping reduce the levels of ambient pollution, in particular the aforementioned nitrogen dioxide.
Noxious smokes and fumes released from diesel fuels would also be reduced, as with newer public transport infrastructure often means newer models of public buses, as well as trains that rely on alternative fuel sources, and as such they would be emitting far less smoke and haze, usually thick with PM2.5 and other toxic compounds such as carbon monoxide (CO), ozone (O3) and soot, which contains large amounts of the aforementioned black carbon.
Besides being highly dangerous to breathe in, black carbon also has grave consequences in terms of climate control, having a prominent effect on a city due to its ability to convert solar radiation directly into heat. Thus, with large initiatives in the public transport sector, would have marked differences in pollution level reduction, which is already being seen.
Are pollution levels in Kolkata getting better?
Whilst pollution levels in Kolkata still have a way to go in order to see the best health of its citizens, it is apparent that pollution levels have improved over the last few years, with a marked improvement in levels of PM2.5 recorded in 2019 as opposed to the few years prior to that. In 2017, the yearly average of PM2.5 was 76.7 μg/m³, still in the unhealthy rating bracket but considerably higher in number than more recent times.
2018 came in with an even worse reading of 85.4 μg/m³, before finally coming to the improved reading of 2019 at 59.8 μg/m³, representing a drop of 25 μg/m³ of particulate matter in the course of a year.
Whilst Kolkata still has plenty of room for improvement, with the excessive numbers of pollution recorded in January skewing the results massively, its 2019 rating was not too far from being moved down a bracket out of the unhealthy rating and down into the ‘unhealthy for sensitive groups’ bracket. Whilst this is still a very long way from the WHO’s target rating of 0 to 10 μg/m³, it would represent a further change in the right direction.
Where is the cleanest air quality in Kolkata?
- Rabindra Sarobar, Kolkata - WBPCB124
- Bidhannagar, Kolkata - WBPCB143
- Fort William, Kolkata - WBPCB152
- Victoria Memorial, Kolkata - WBPCB155
- National Atlas Bhaban156
- Maulana Azad Collage160
- Ballygunge, Kolkata - WBPCB162
- WBPCB Office, Saltlake163
- Jadavpur, Kolkata - WBPCB166
- Lorreto College169
- Avidipta Housing Complex170
- Flora Fountain181
- Bethune College183
- Rabindra Bharati University, Kolkata - WBPCB183
- Jadavpur University186
- Lady Brabourne College187
- Dhapa Lock Pumping Station188
- Urbana Housing Complex229
- Ballygunge Campus, C.U252
- Presidency University254