Air quality in Melbourne
Air quality index (AQI⁺) and PM2.5 air pollution in Melbourne • 672.7K Followers • 22:00, Jan 29 Local time
32
US AQI⁺Good

Main pollutant:
PM10
35.6 µg/m³
21°
14.8 km/h
79 %
Hourly forecast
Melbourne air quality index (AQI⁺) forecast
Daily forecast
Melbourne air quality index (AQI⁺) forecast
| Today | 42 | 29° 15° | 18 km/h | 50% | |
| Fri | 58 | 28° 20° | 18 km/h | 43% | |
| Sat | 52 | 90% | 24° 18° | 21.6 km/h | 60% |
Air pollutants
What is the current air quality in Melbourne?
PM2.5 concentration currently meets the WHO annual PM2.5 guideline.

Health recommendations
Enjoy outdoor activities |
Open your windows to bring clean, fresh air indoors Get a monitor |
Protect yourself from air pollution in Melbourne
Shop IQAir productsWhen the air becomes a problem – we provide relief
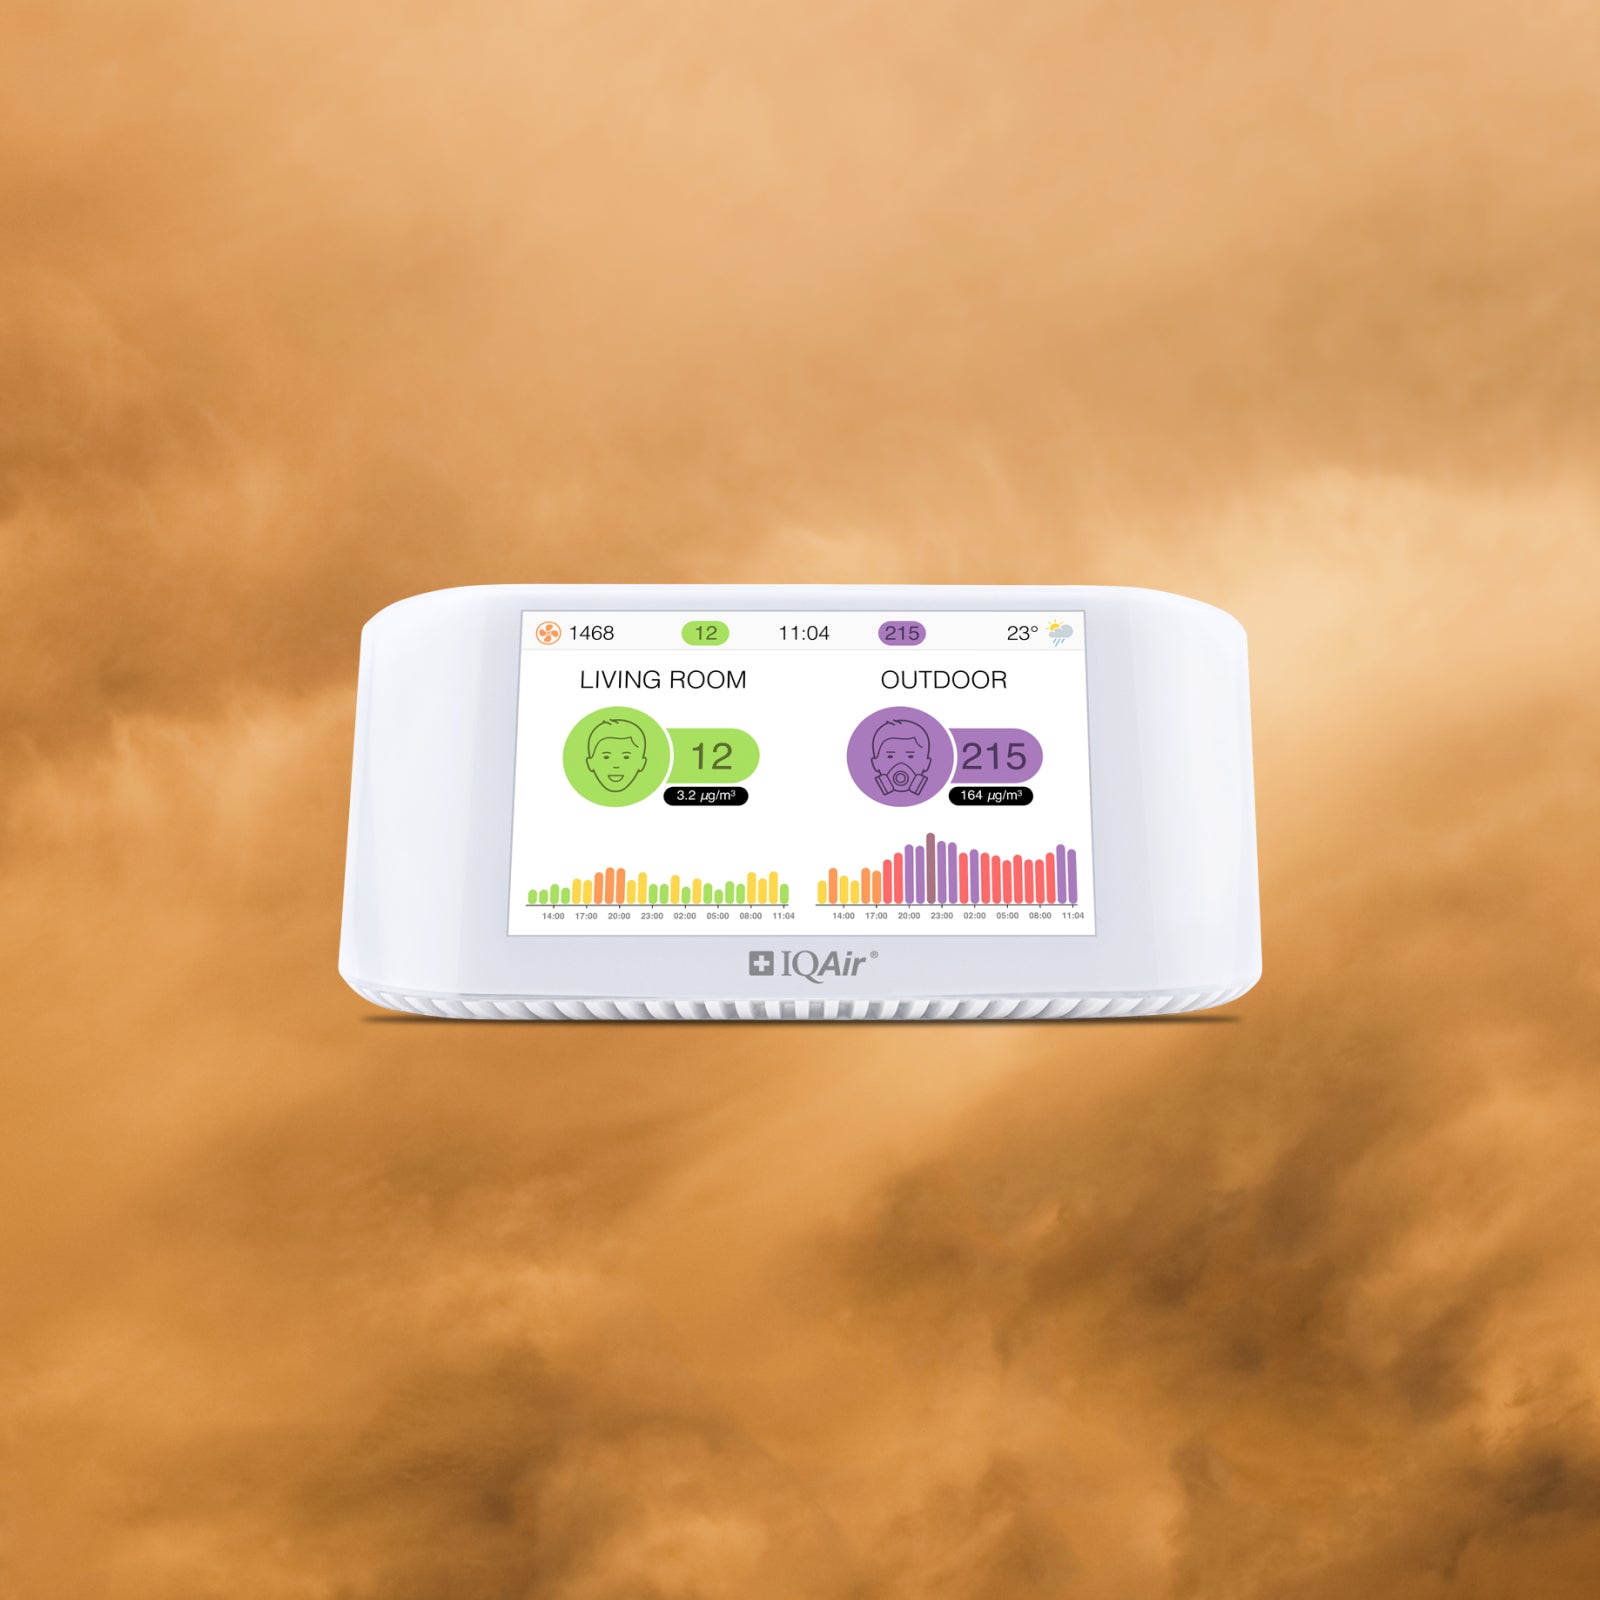
Monitor the air you breathe
Get accurate AirVisual air quality readings and real-time insights for cleaner air. Monitors that reveal pollution sources, highlight when air purifier use is needed.
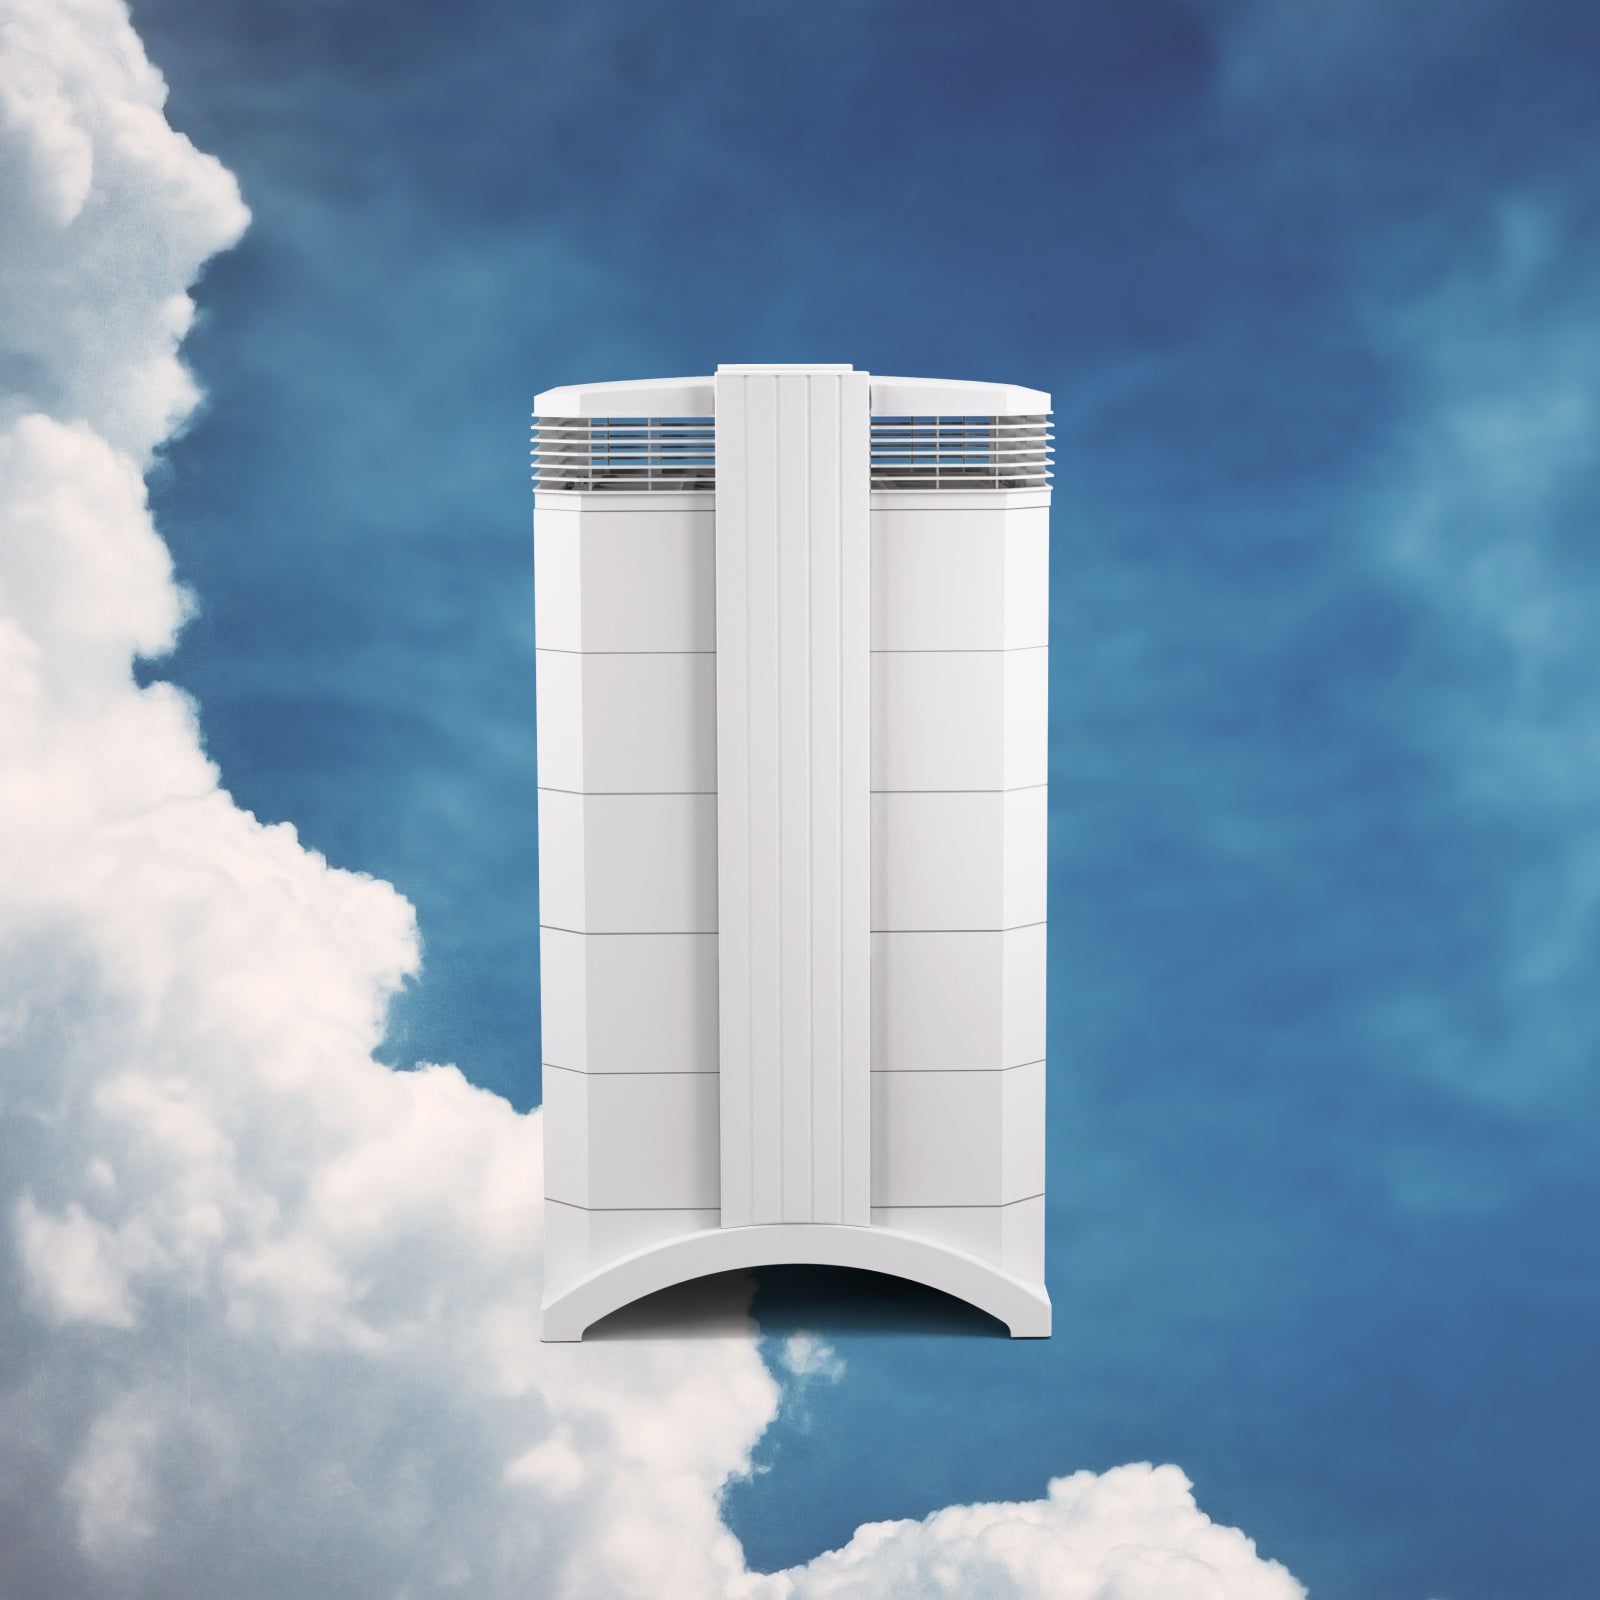
Medical grade air purifiers
Trusted worldwide, the HealthPro Series uses HyperHEPA technology. Filters ultrafine particles other air purifiers miss, delivering medical-grade protection.
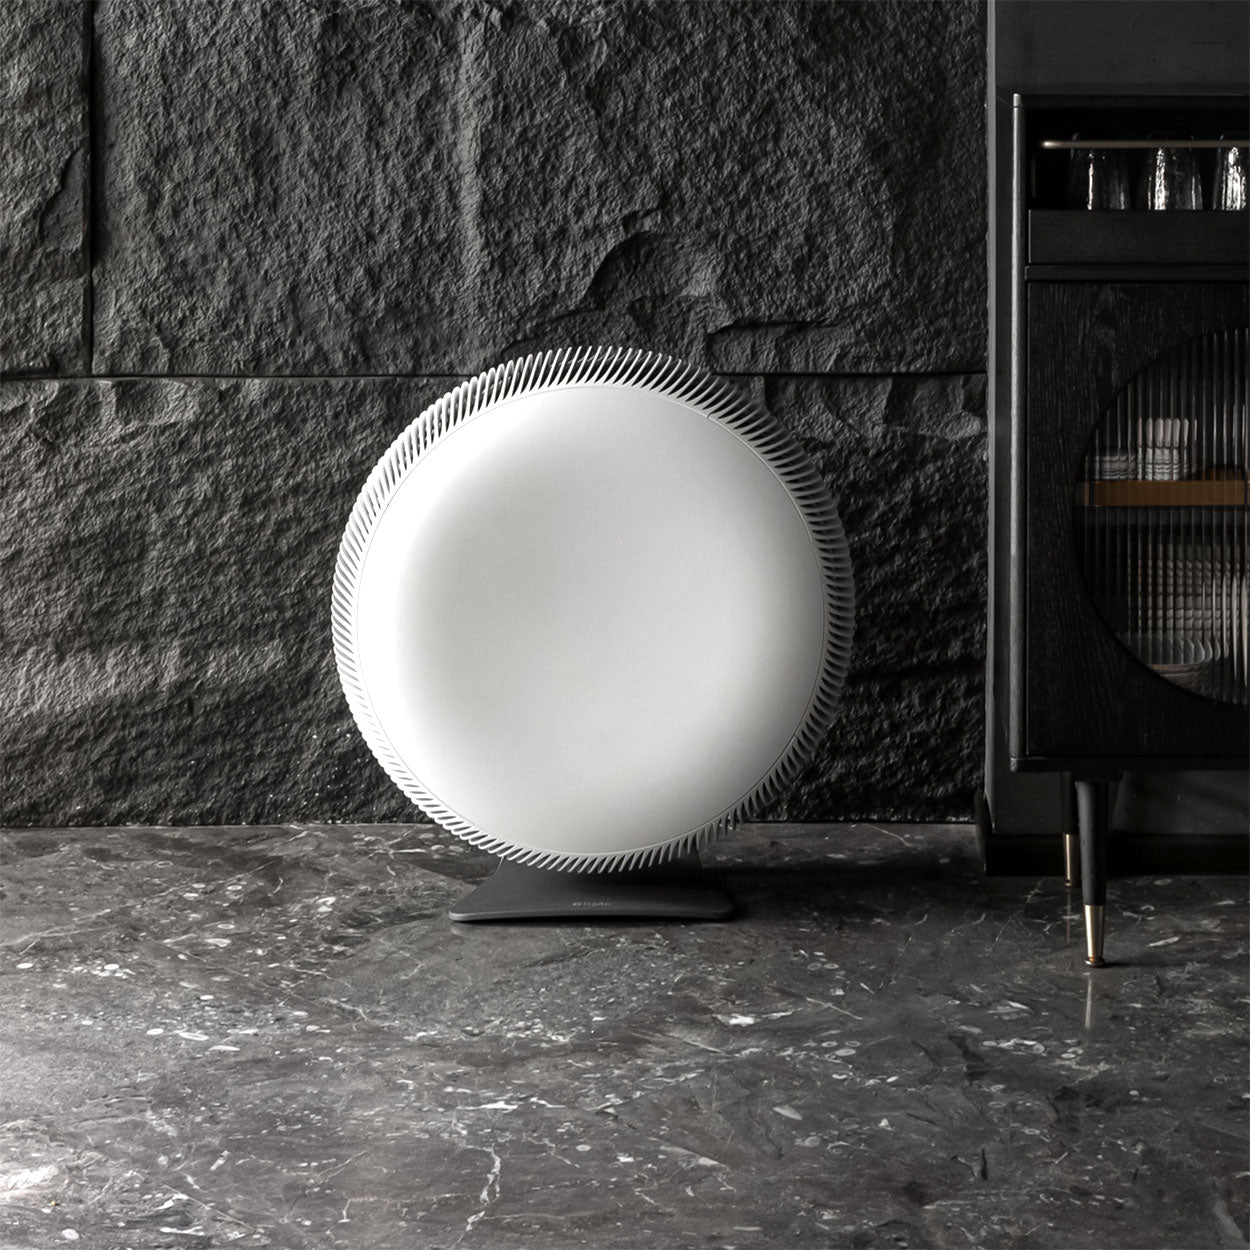
Powerful, stylish air purifiers
Compact and powerful, the Atem Series combines Swiss engineering with high-performance air purification, filtering ultrafine particles with HyperHEPA technology.
Pollen
What is the pollen count in Melbourne today?
Index

None
Tree None | 0% |
Grass None | 0% |
Weed None | 0% |
Source:
wetter.comHealth recommendations
Enjoy outdoor activities |
Open your windows to bring clean, fresh air indoors Get a monitor |
Pollen
What is the pollen count in Melbourne today?
Index
None
Tree None | 0% |
Grass None | 0% |
Weed None | 0% |
Source:
wetter.comProtect yourself from air pollution in Melbourne
Shop IQAir productsWhen the air becomes a problem – we provide relief
Monitor the air you breathe
Get accurate AirVisual air quality readings and real-time insights for cleaner air. Monitors that reveal pollution sources, highlight when air purifier use is needed.
Medical grade air purifiers
Trusted worldwide, the HealthPro Series uses HyperHEPA technology. Filters ultrafine particles other air purifiers miss, delivering medical-grade protection.
Powerful, stylish air purifiers
Compact and powerful, the Atem Series combines Swiss engineering with high-performance air purification, filtering ultrafine particles with HyperHEPA technology.
Most polluted locations near Melbourne
Worldwide AQI⁺ rankingStation ranking
Real-time Australia AQI⁺ station ranking
City ranking
Real-time Australia AQI⁺ city ranking
Historic air quality near Melbourne
History
Historic air quality graph for Melbourne
Historic air quality near Melbourne
History
Historic air quality graph for Melbourne
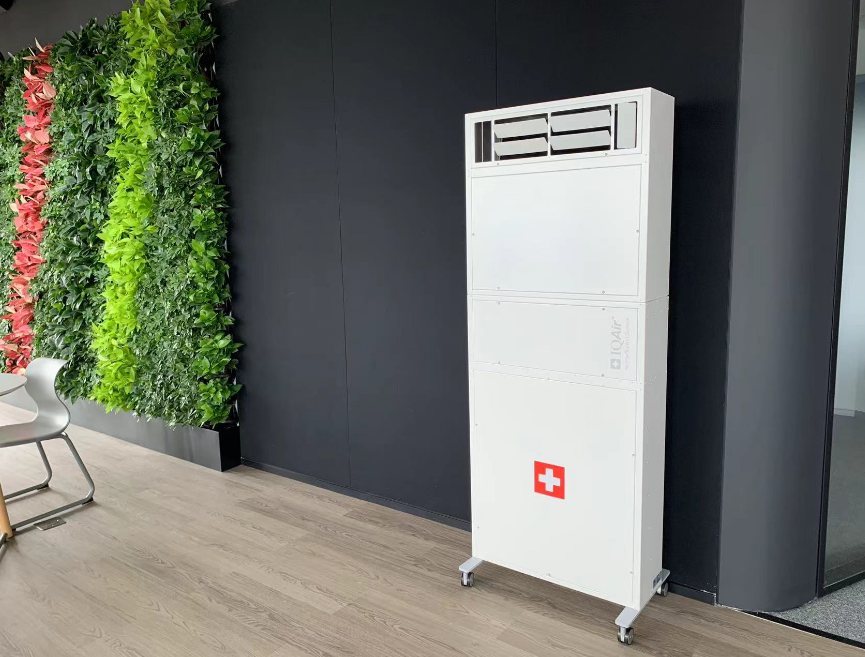
Clean Air Facilities
Most polluted locations near Melbourne
Worldwide AQI⁺ rankingStation ranking
Real-time Australia AQI⁺ station ranking
City ranking
Real-time Australia AQI⁺ city ranking


Measure your own air quality
Get a monitor and contribute air quality data in your city.
Learn more about air pollution in Melbourne
How bad is Melbourne air quality?
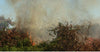
Similarly to much of Australia, Melbourne generally experiences relatively healthy air in global comparison to other major cities. However, like many other Australian regions, the capital of Victoria state is also subject to occasional extreme air pollution events, which can pose significant health risks to its almost 5 million residents. Such extreme events notably include bushfires, which typically occur on an annual basis around various parts of Australia. While Melbourne’s annual average concentration of fine particulate matter (PM2.5) was a relatively low 6.5 μg/m3 during 2019, meeting both the Australian and World Health Organisation annual targets (8 μg/m3 and 10 μg/m3 respectively), the devastating Australian bushfires of 2019-2020 led the city to experience extremely high levels of air pollution, creating an extraordinary contrast.1 Melbourne air pollution briefly registered as the highest in the world, with “Hazardous” levels of PM2.5 peaking at 470 μg/m3 during 14 January 2020.2 During that same day, Melbourne’s PM2.5 levels recorded a 24 hour average level of 234 μg/m3, which exceeds both the World Health Organisation (WHO) and Australian government’s shared 24-hour exposure limit of 25 μg/m3, by almost 10 times.1
Aside from short-term pollution events, Melbourne air quality also experiences relatively low, but persistent levels of a range of pollutants year-round. Common outdoor air pollutants in the Victoria region include carbon monoxide (CO), sulphur dioxide (SO2), nitrogen oxides (NOx), ozone (O3), and particulate matter measuring a diameter of less than 2.5 or 10 microns (abbreviated to PM2.5 and PM10, respectively).3 Among these, PM2.5 and ozone are the main pollutants of concern for their impact on human health. This is due to PM2.5’s continuous presence in the air (even at relatively low levels), and the numerous sources that it can be emitted from.3 For ozone, this is due to concerns that the pollutant could increase over time with growing populations and rising temperatures.3
Real-time updates on Melbourne air pollution area shown at the top of this page, together with a 7-day air quality forecast. The dynamic air quality map also indicates live wildfire updates along with air quality information.
What are the health impacts of air pollution in Melbourne?
The health impacts of exposure to PM2.5 include increasing people’s risk of developing cardiovascular disease, respiratory infections, chronic obstructive pulmonary disease (COPD) and lung cancer, while short-term effects can also include aggravation of asthma, and eye, nose and throat irritation.4 Meanwhile, exposure to ozone increases risk of asthma-related morbidity and mortality.4 Victoria’s Department of Environment, Land, Water and Planning (DELWP) has estimated that the health impacts resulting from exposure toVictoria air pollution across Melbourne’s state, cost the state an enormous $420 to $600 million (AUD, equivalent to $300 to $427 million USD) from pollution generated by the electricity sector in one year alone. Health impacts from transport-related air pollution were estimated to cost an even larger $660 million to $1.5 billion (AUD), based on 2005 data (equivalent to $470 million to $1.07 billion USD).3
Australia air quality is subject to some of the strictest standards in the world, which Melbourne air pollution is also governed by. The country targets an annual average PM2.5 limit of 8 μg/m3, which is lower than both the World Health Organisation’s standard (10 μg/m3), American standard (12 μg/m3) and European standard (25 μg/m3). This reflects how on the whole, Australian pollution levels are relatively low by global standards. However, the WHO emphasises that there is no “safe” level of PM2.5 exposure below which no health impacts can be observed.4
What are the main sources of air pollution in Melbourne?
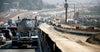
In Melbourne’s state of Victoria, the main sources of air pollution are motor vehicles, power generation, and smoke from wood heaters, planned burning and bushfires.3 Future trends such as anticipated climate change and population growth are expected to increase emissions of pollutants from domestic and business activities (such as heating), and temperature-related activities. Melbourne and Geelong’s population is expected to grow by 45% between 2006 and 2030, while greater Melbourne’s population is predicted to reach 8 million by 2051. This growth will stimulate a larger share of demand for energy-related activities such as heating, and associated emissions. Regarding climate change, particulate matter is forecast to increase in future as a warmer and drier climate drives more bushfires and dust storms, while rising temperatures can also drive higher levels of ozone, which is formulated in sunlight and tends to be more prevalent during summer months.5 Conversely, improvements in vehicle exhaust emission technologies and increasing uptake of electric vehicles (EVs) is predicted to result in decreasing levels of transport-related pollutants, such as volatile organic compounds and nitrogen dioxide in future.5
Has the air quality improved in Melbourne?
While Melbourne’s winter months generally show improved air quality compared to the bushfire-prone summer months each year, on the whole, levels of fine particulate matter in Melbourne have shown a slight trend of increasing during the past 3 years. In 2019, Melbourne’s annual average concentration of PM2.5 was 6.5 μg/m3, slightly above 2018’s annual average (5.8 μg/m3) and 2017’s annual average (5.4 μg/m3).1 This may reflect the trend outlined above, that population growth, climate change and increasing temperatures may increase levels of particulate matter over time. A similar increasing trend was also observed inSydney air quality (2019, 10.1 μg/m3; 2018, 7.6 μg/m3; 2017, 7.1 μg/m3), andNewcastle air pollution (2019, 12.5 μg/m3; 2018, 7.9 μg/m3; 2017, 7.4 μg/m3).1 However, in the short-term, experts suggest that since the extensive bushfires of 2019-2020 burned up so much “fuel” (in the form of trees, forest and dead plant material), the affected areas such as Melbourne may not experience bushfires to the same extent during the subsequent 3 to 5 years, while these resources are recovering.6
What is being done about air pollution in Melbourne?
The Victoria Environment Protection Agency (EPA) is responsible for managing air pollution within the Victoria state, with the aim of achieving Australia’s broader national air quality objectives and standards. The Australian air quality standards are known as the National Environment Protection (Ambient Air Quality) Measures (NEPM). The Victoria EPA runs a network of air quality monitors, and prior to November 2019, it followed the Australian Air Quality Index system to communicate levels of health hazard to the public.7
While the nationwide AQI system would calculate a Melbourne Air Quality Index as a percentage of the NEPM standards, whereby an AQI of ‘100’ represents the maximum allowable amount of a specified pollutant, and AQI numbers above 100 represent an exceedance; the Victoria EPA now uses a different system. Rather than a Melbourne AQI number, the Victoria EPA instead communicates health hazard using ‘air quality categories’, where 0-50 indicates ‘Good’, and 300 and above indicates ‘Hazardous’ air quality.
Victoria’s EPA also implements a range of initiatives aimed at reducing air pollution emissions from transport. These include the Australia-wide Environment Protection (Vehicle Emissions) Regulations of 2013, which impose regulation on both air and noise emissions from vehicles; enforcing the Australian Design Rules (ADRs), a set of national rules that require domestically manufactured or imported vehicles to meet requirements, including exhaust emission standards; and also implementing the national fuel quality standards, in addition to the National Environment Protection Measures (NEPM) which aim to reduce diesel emissions.8
Is Melbourne Australia affected by the fires?
During the 2019-2020 bushfires across Australia, colloquially referred to as the “black summer”, Melbourne’s state Victoria was the second-worst hit state in Australia, following its neighbour New South Wales.9 Although Australia has long had a fire season, with bushfires happening annually as a result of natural lightning strikes, or through human action such as accidental sparks or planned burning, the fires of the black summer were particularly bad due to record-breaking temperatures and months of drought.8 During the black summer, 1.2 million hectares of land were burned across Victoria, and the fires resulted in high levels of smoke pollution in Melbourne, posing a hazard to human health.2,8
+ Article resources
[1] IQAir. “2019 World Air Quality Report”. IQAir website, March 18, 2020.
[2] Matt Woodley. “’Hazardous’ Melbourne air considered worst in the world”. RACGP, January 14, 2020.
[3] Victoria Department of Environment, Land, Water and Planning (DELWP). “Estimating the health costs of air pollution in Victoria”. Victoria government website, 2018.
[4] World Health Organisation. “Ambient (outdoor) air pollution”. WHO website, May 2, 2020.
[5] Victoria DELWP. “Clean Air Fact Shee: Air pollution sources, impacts and trends.” Victoria government DELWP website, 2018.
[6] Kevin Tolhurst. “It’s 12 months since the last bushfire season began, but don’t expect the same this year”. The Conversation, June 10, 2020.
[7] Victoria EPA. “How we calculate air quality categories”. Victoria EPA website, n.d.
[8] EPA Victoria. “How we improve vehicle emissions”. EPA Victoria website, June 12, 2020.
[9] BBC. “Australia fires: A visual guide to the bushfire crisis”. BBC website, January 31, 2020.
Where is the cleanest air quality in Melbourne?
- Williamstown Road1
- 1 Geraldine St4
- Yunupingu Dr4
- Kalimna Street12
- Kealba Landfill North Air Monitor14
- 30 Emma Street17
- Marshall Road23
- Altona Station24
- Booth Street25
- Moreland Road25
- 2-11 Colgoa Ct26
- Narooma Place26
- 9-77 Sunnyside Cres28
- Cala St28
- Long Beach Trail Park28
- 22 Canterbury Cl31
- Moor Street33
- State Route 5033
- 107-121 Station St37
- Boundary Road50
- Veronica Crescent58
- Alphington Station59
- Melbourne CBD63