Air quality in Montreal
Air quality index (AQI⁺) and PM2.5 air pollution in Montreal • 259K Followers • 06:00, Jan 29 Local time
58
US AQI⁺Moderate

Main pollutant:
PM2.5
13 µg/m³
-13°
7.7 km/h
89 %
Hourly forecast
Montreal air quality index (AQI⁺) forecast
Daily forecast
Montreal air quality index (AQI⁺) forecast
| Today | 51 | 100% | -10° -18° | 14.4 km/h | 88% |
| Fri | 10 | -14° -21° | 18 km/h | 88% | |
| Sat | 15 | -12° -21° | 14.4 km/h | 88% |
Air pollutants
What is the current air quality in Montreal?
PM2.5 concentration is currently 2.6 times the World Health Organization annual PM2.5 guideline value.

Health recommendations
Sensitive groups should reduce outdoor exercise |
Close your windows to avoid dirty outdoor air Get a monitor |
Sensitive groups should wear a mask outdoors Get a mask |
Sensitive groups should run an air purifier Get an air purifier |
Protect yourself from air pollution in Montreal
Shop IQAir productsWhen the air becomes a problem – we provide relief
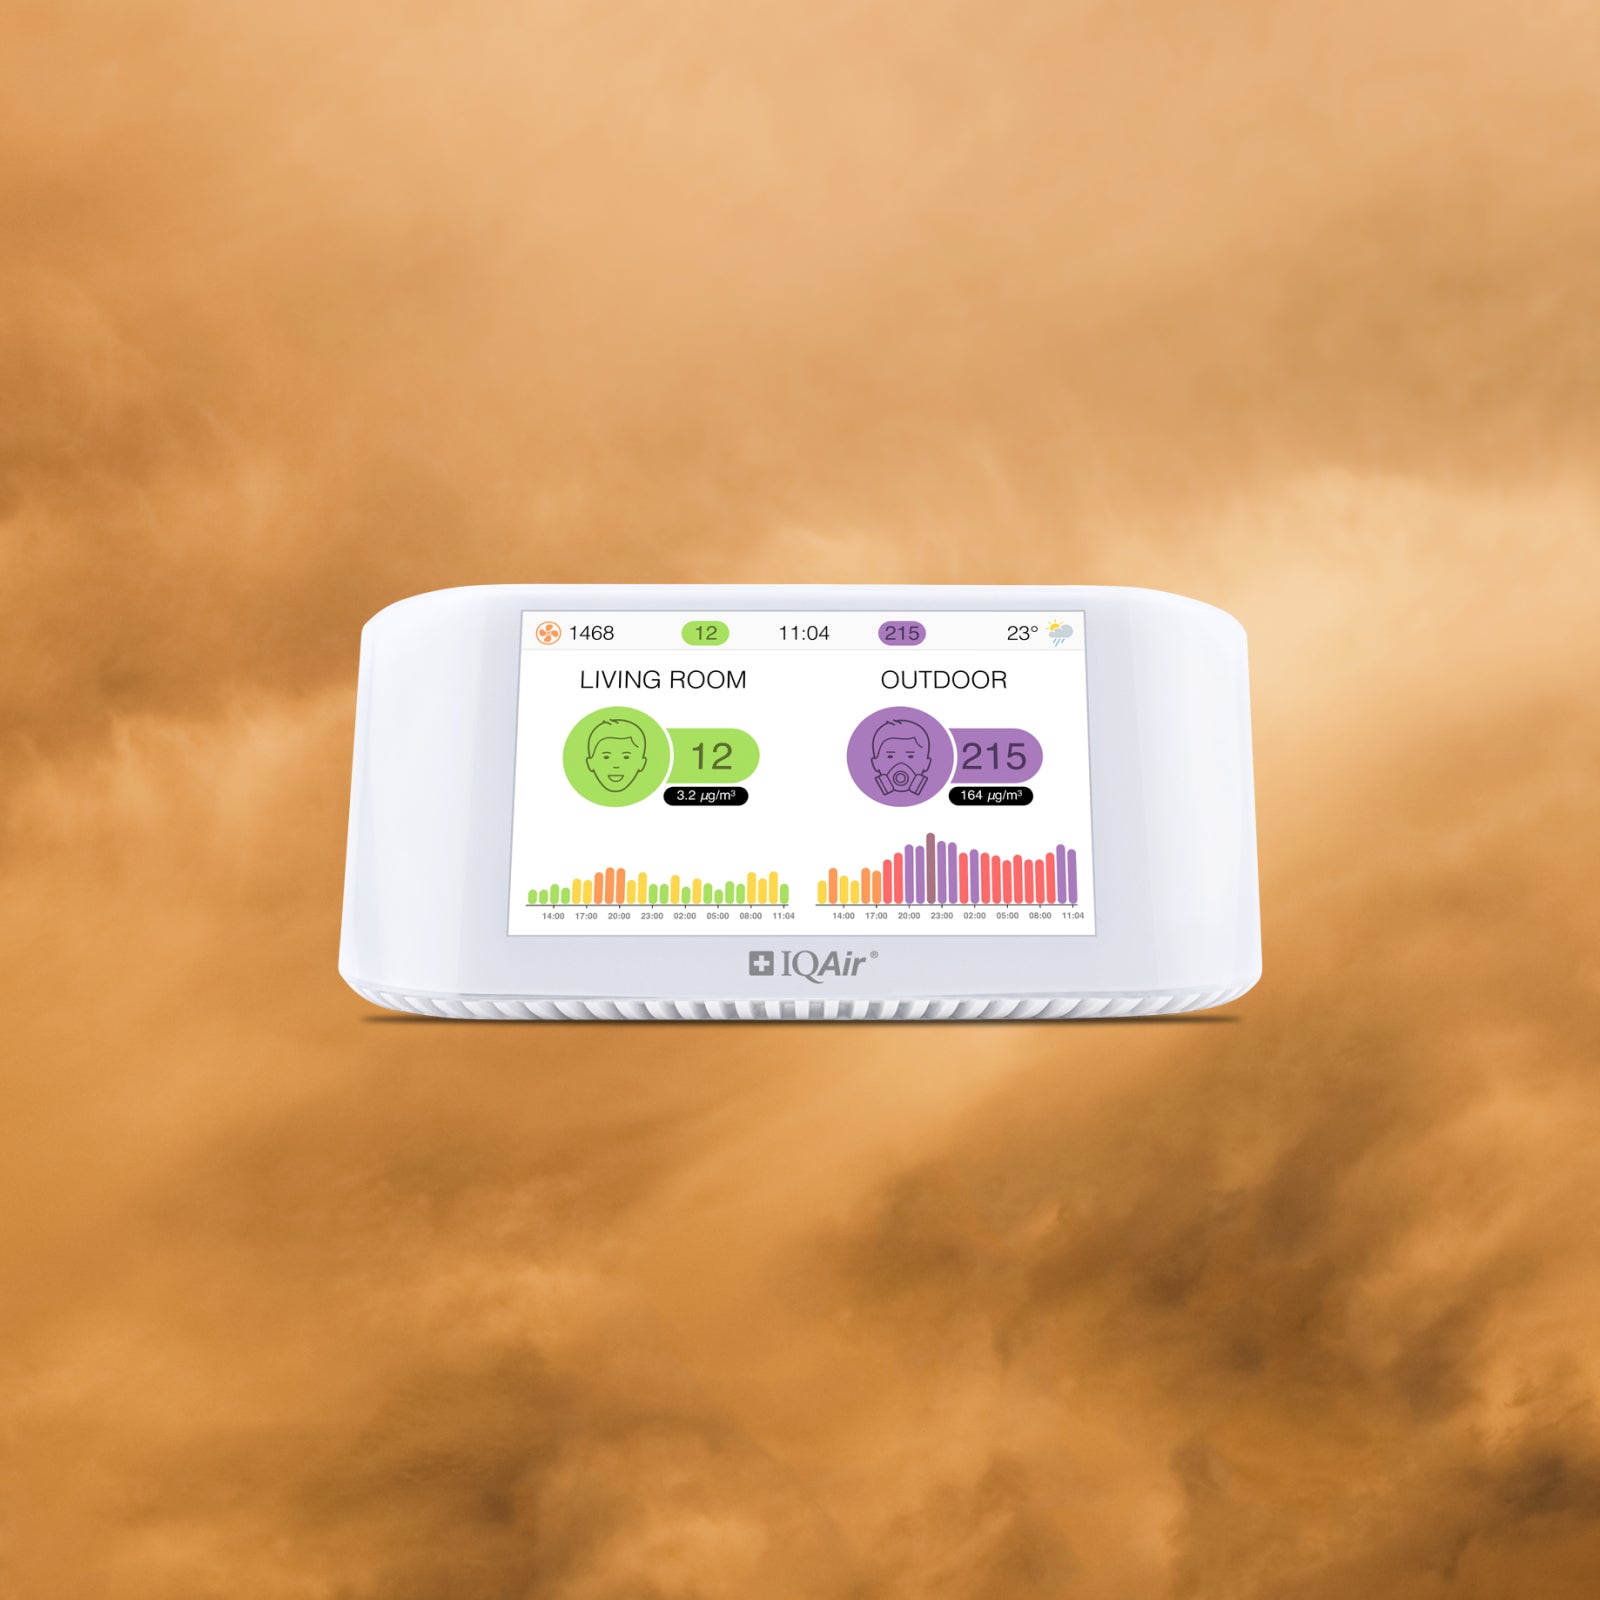
Monitor the air you breathe
Get accurate AirVisual air quality readings and real-time insights for cleaner air. Monitors that reveal pollution sources, highlight when air purifier use is needed.
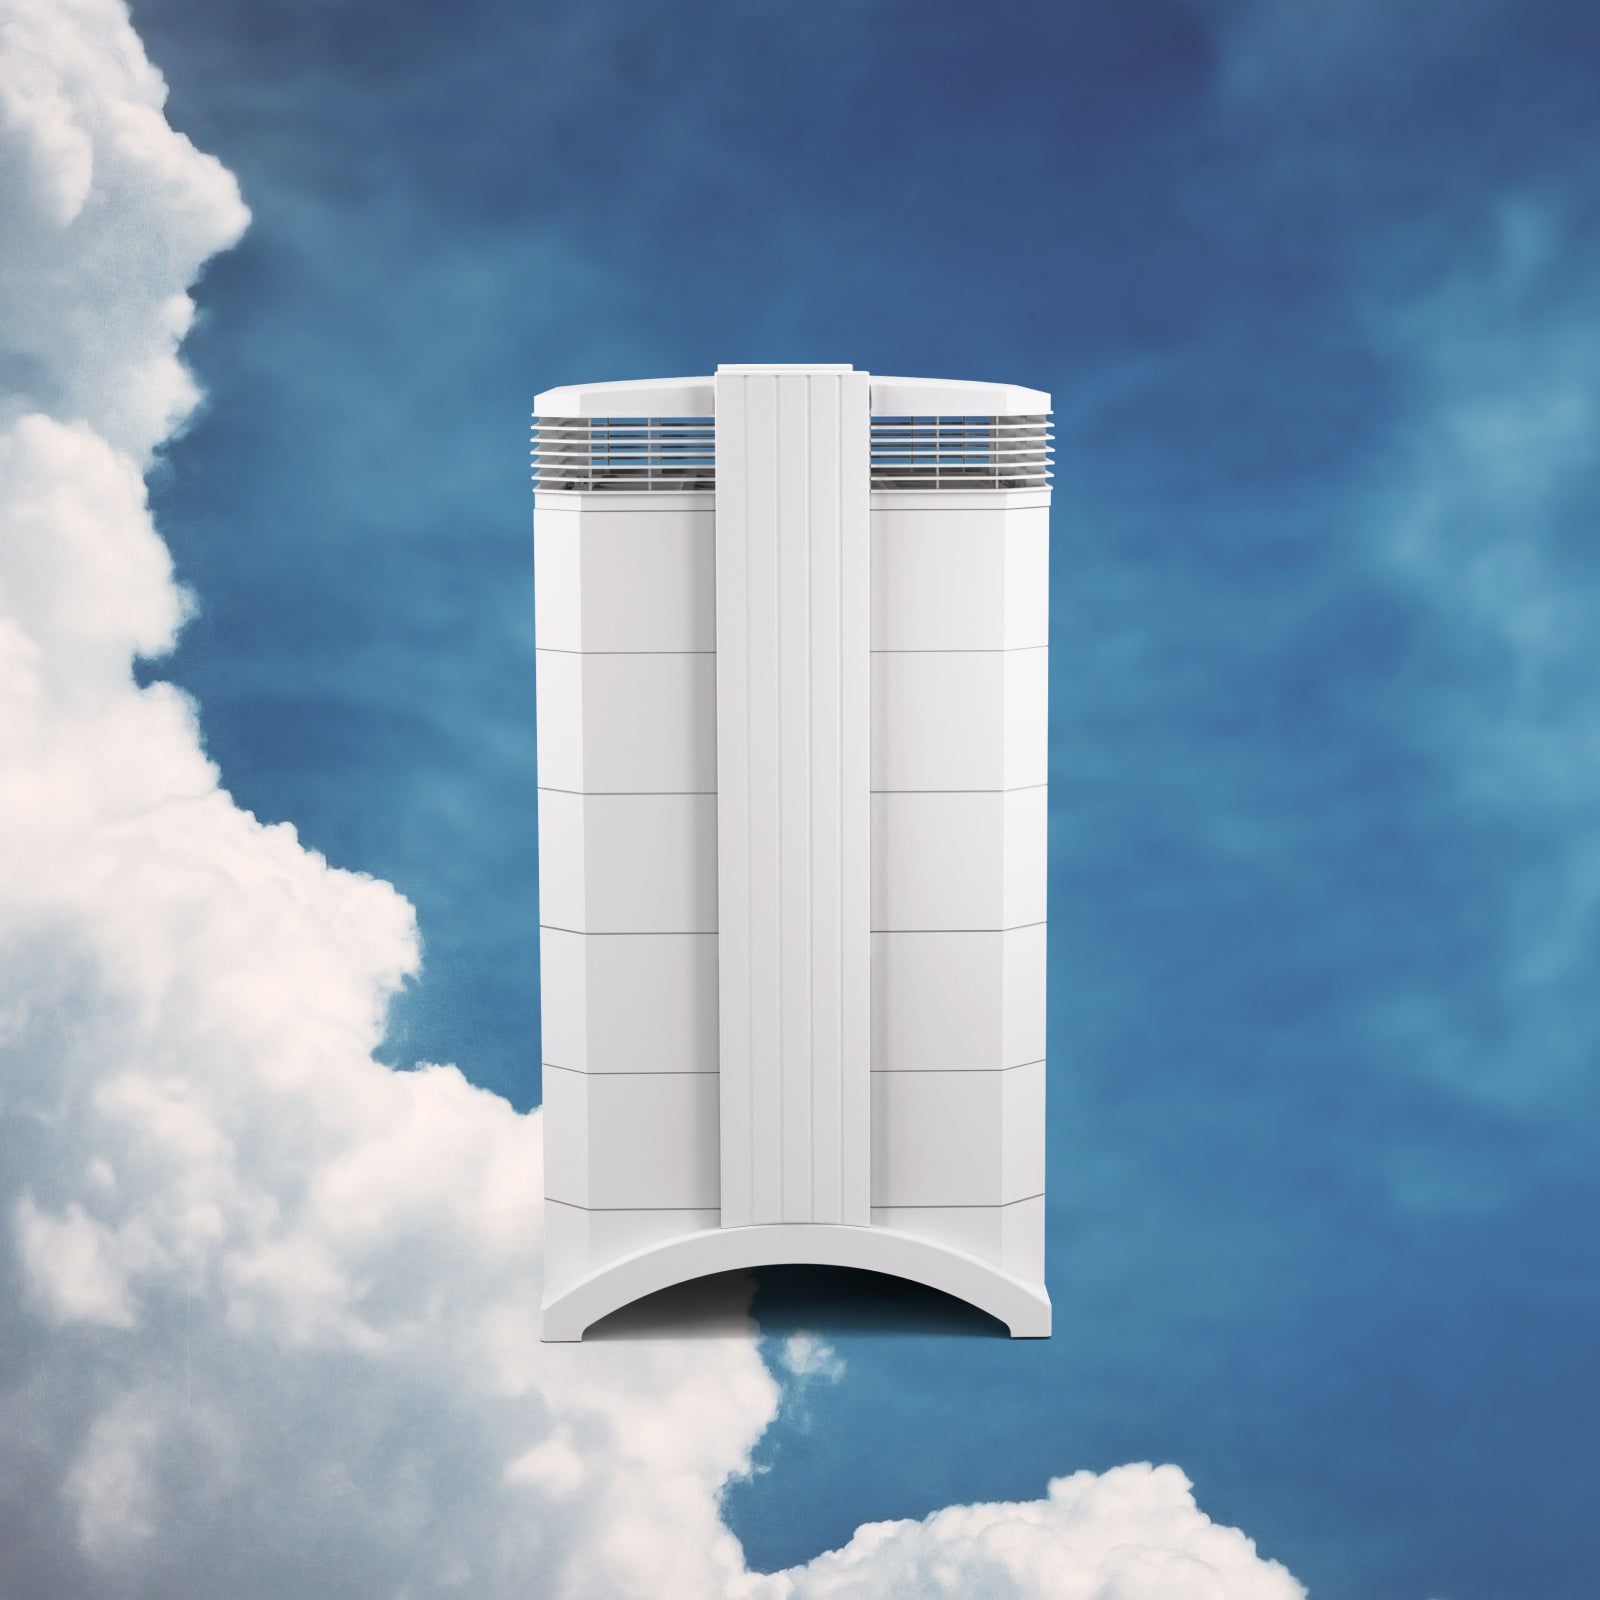
Medical grade air purifiers
Trusted worldwide, the HealthPro Series uses HyperHEPA technology. Filters ultrafine particles other air purifiers miss, delivering medical-grade protection.
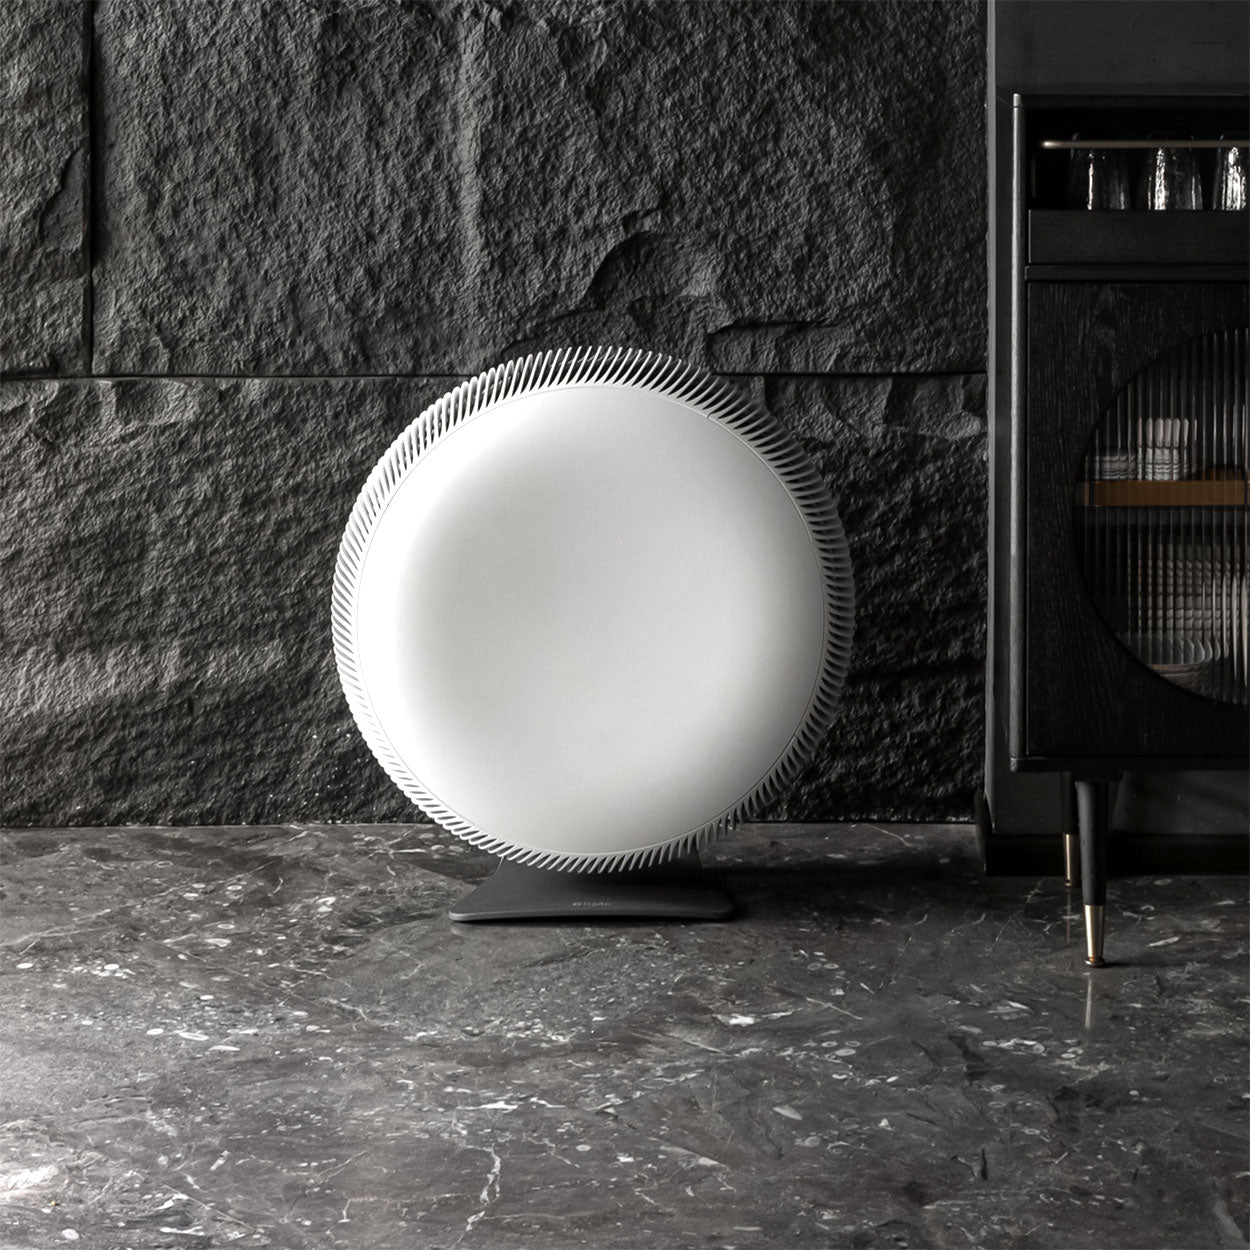
Powerful, stylish air purifiers
Compact and powerful, the Atem Series combines Swiss engineering with high-performance air purification, filtering ultrafine particles with HyperHEPA technology.
Clean Air Facilities
Pollen
What is the pollen count in Montreal today?
Index

None
Tree None | 0% |
Grass None | 0% |
Weed None | 0% |
Source:
wetter.comHealth recommendations
Sensitive groups should reduce outdoor exercise |
Close your windows to avoid dirty outdoor air Get a monitor |
Sensitive groups should wear a mask outdoors Get a mask |
Sensitive groups should run an air purifier Get an air purifier |
Pollen
What is the pollen count in Montreal today?
Index
None
Tree None | 0% |
Grass None | 0% |
Weed None | 0% |
Source:
wetter.comProtect yourself from air pollution in Montreal
Shop IQAir productsWhen the air becomes a problem – we provide relief
Monitor the air you breathe
Get accurate AirVisual air quality readings and real-time insights for cleaner air. Monitors that reveal pollution sources, highlight when air purifier use is needed.
Medical grade air purifiers
Trusted worldwide, the HealthPro Series uses HyperHEPA technology. Filters ultrafine particles other air purifiers miss, delivering medical-grade protection.
Powerful, stylish air purifiers
Compact and powerful, the Atem Series combines Swiss engineering with high-performance air purification, filtering ultrafine particles with HyperHEPA technology.
Most polluted locations near Montreal
Worldwide AQI⁺ rankingStation ranking
Real-time Canada AQI⁺ station ranking
City ranking
Real-time Canada AQI⁺ city ranking
Historic air quality near Montreal
History
Historic air quality graph for Montreal
Historic air quality near Montreal
History
Historic air quality graph for Montreal
Clean Air Facilities
Most polluted locations near Montreal
Worldwide AQI⁺ rankingStation ranking
Real-time Canada AQI⁺ station ranking
City ranking
Real-time Canada AQI⁺ city ranking


Measure your own air quality
Get a monitor and contribute air quality data in your city.
Learn more about air pollution in Montreal
Is Montreal a city with polluted air?
Montreal is a city located in the Canadian province of Quebec, being the most populous city of the province and second most populous city in the whole of Canada. It lies just above the United States border, and is home to a majority of French Canadians, with English being the second most commonly spoken language. It has the second largest economy of all Canadian cities, with industries based around the manufacturing and production of electronic goods, software engineering, textiles and clothes, as well as being one of the largest port cities in the country, with the port of Montreal handling an average of 26 million tons of cargo every year.
Looking at the quality of its air, Montreal came in with a PM2.5 average of 10 μg/m³ over the course of 2019, a reading which placed it into the World Health Organizations (WHO's) target goal of 10 μg/m³ or less, showing that it made its way into this ratings category by a very fine margin. This reading placed it in 2571st place out of all cities ranked worldwide, as well as 13th place out of all countries ranked in Canada. This is indicative that Montreal has a good quality of air, despite a large and ever growing population coupled with extensive industry and other related anthropogenic activity. Whilst there are some months that came in with less appreciable readings of PM2.5, it stands to reason that overall, Montreal citizens are fortunate enough to live in a city that falls within the WHO's target for its yearly average.
What are the main causes of pollution in Montreal?
There are a number of different sources that assist in the raising of Montreal's year round air pollution readings, as well as the months that see heightened readings coming in, with a combination of both polluting sources as well as meteorological conditions determining the pollution readings, with factors such as wind speed, humidity and temperature all having a part to play.
One of these main causes would be the use of cars and other vehicles, with a population of more than 1.7 million people there would subsequently be a massive amount of vehicles in use. These can release large amounts of pollution, with areas that see high volumes of traffic being the worst affected, so much so that people who have to take daily commutes in high traffic areas as well as those who live nearby major roads being at increased risk of adverse health effects, due to the amount of pollutants and fine particulate matter being put out. Other causes include factory and industrial zone emissions, particularly in regards to supplying energy to the population.
During colder months the demand for heating in homes and businesses would grow, and so too would the demand for energy to provide such heating. Factories would thus go through large amounts of fuels such as coal to provide these energy needs, which in turn puts out even more pollution. In finishing, traditional homes and fireplaces that utilize wood during the colder months also put out large amounts of smoke, something that has been made illegal in recent times but still continues to occur. These are a few of the sources of pollution that bring up the PM2.5 reading in Montreal.
When are pollution levels at their highest in Montreal?
Observing the data taken over the course of 2019, it can be seen that Montreal had a pattern emerge as to when the pollution levels were at their worst, and as mentioned before there was indeed a correlation with the winter months, with the worst readings coming during the coldest points of the year, albeit with one anomaly during the course of the year where a higher PM2.5 reading went up in the middle of the summer months.
The pollution levels started to rise at the very end of the year, with November being the month where a clear elevation made itself visible. October came in with a reading of 9 μg/m³, putting it within the WHO's target goal, whilst the following month of November came in at 10.1 μg/m³, and then a further 10.4 μg/m³ in December. Whilst these are not massive jumps in pollution, as are sometimes witnessed in other countries, they still represent a higher reading of pollution, and continue on into the following year. January showed a somewhat lower reading despite the polluted end of year months preceding it, with a reading of 9.5 μg/m³.
This however was followed by the two most polluted months of the year, February and March, which came in with PM2.5 readings of 13.8 μg/m³ and 14.2 μg/m³ respectively. These numbers were high enough to place them in the ‘moderate’ ratings bracket, the only two months of the year to do so, a less than appreciable ratings group that requires a PM2.5 reading of 12.1 to 35.4 μg/m³ for classification. So, in closing, the period of highest pollution levels in Montreal were from November through to March of the following year, with February and March being the most polluted during this period.
When does Montreal have the best quality of air?
In contrast to the previous question, as mentioned, Montreal starts to show its better air quality after the more polluted cold months, which typically come to a close in March. From then on follows the period of time that the air is at its cleanest, free from a large amount of haze, smog and fumes that would permeate the air during the most polluted months. April through to October had the best quality of air, with the exception of July which came in with an anomalous reading of 12 μg/m³.
The months that had the absolute cleanest air during this period were April and May, which came in with PM2.5 readings of 7.9 μg/m³ and 7.8 μg/m³ respectively, making May the cleanest months of the entire year.
What are some health consequences of breathing polluted air in Montreal?
With its year round clean air average, those living in Montreal are subject to breathing good, pollution free air. However as mentioned, with certain months being more polluted as well as certain zones such as high traffic areas or for people living in the vicinity of factories or industrial zones, there may be some health consequences. These would include respiratory ailments such as pneumonia, bronchitis, emphysema and asthma occurring, as well as rapid aging and scarring of the lung tissue, if enough particulate matter is inhaled.
Pregnant mothers are particularly at risk as well, with chances of women exposed suffering from unwanted effects such as higher chances of miscarriage, babies born prematurely or with a low birth weight, and as such the infant mortality rate would be higher. So, whilst there is not an overt danger that comes with breathing the air in Montreal for most of the year, there are certain months and areas that would cause an increase in illnesses or adverse effects occurring.
Where is the cleanest air quality in Montreal?
- Outremont38
- Parc Beaubien42
- Petite Bourgogne42
- Verdun51
- 199-245 Rue de la Montagne52
- Percival Molson stadium - north roof52
- PARC HENRI-JULIEN54
- Rue Duchesneau55
- Molson57
- St-Dominique58
- Caserne 1760
- Avenue Royalmount61
- York-Roberval65
- Avenue de l'Esplanade66
- 2237 Ave Blanchard70
- Saint-Jean-Baptiste72
- Aéroport de Montréal73
- Rivière-des-Prairies77
- CHATEAUNEUF94