Air quality in Toronto
Air quality index (AQI⁺) and PM2.5 air pollution in Toronto • 903.1K Followers • 06:00, Jan 29 Local time
26
US AQI⁺Good

Main pollutant:
PM2.5
4.7 µg/m³
-12°
37 km/h
81 %
Hourly forecast
Toronto air quality index (AQI⁺) forecast
Daily forecast
Toronto air quality index (AQI⁺) forecast
| Today | 20 | -12° -24° | 14.4 km/h | 82% | |
| Fri | 18 | -12° -26° | 10.8 km/h | 84% | |
| Sat | 12 | -11° -20° | 10.8 km/h | 84% |
Air pollutants
What is the current air quality in Toronto?
PM2.5 concentration currently meets the WHO annual PM2.5 guideline.

Health recommendations
Enjoy outdoor activities |
Open your windows to bring clean, fresh air indoors Get a monitor |
Protect yourself from air pollution in Toronto
Shop IQAir productsWhen the air becomes a problem – we provide relief
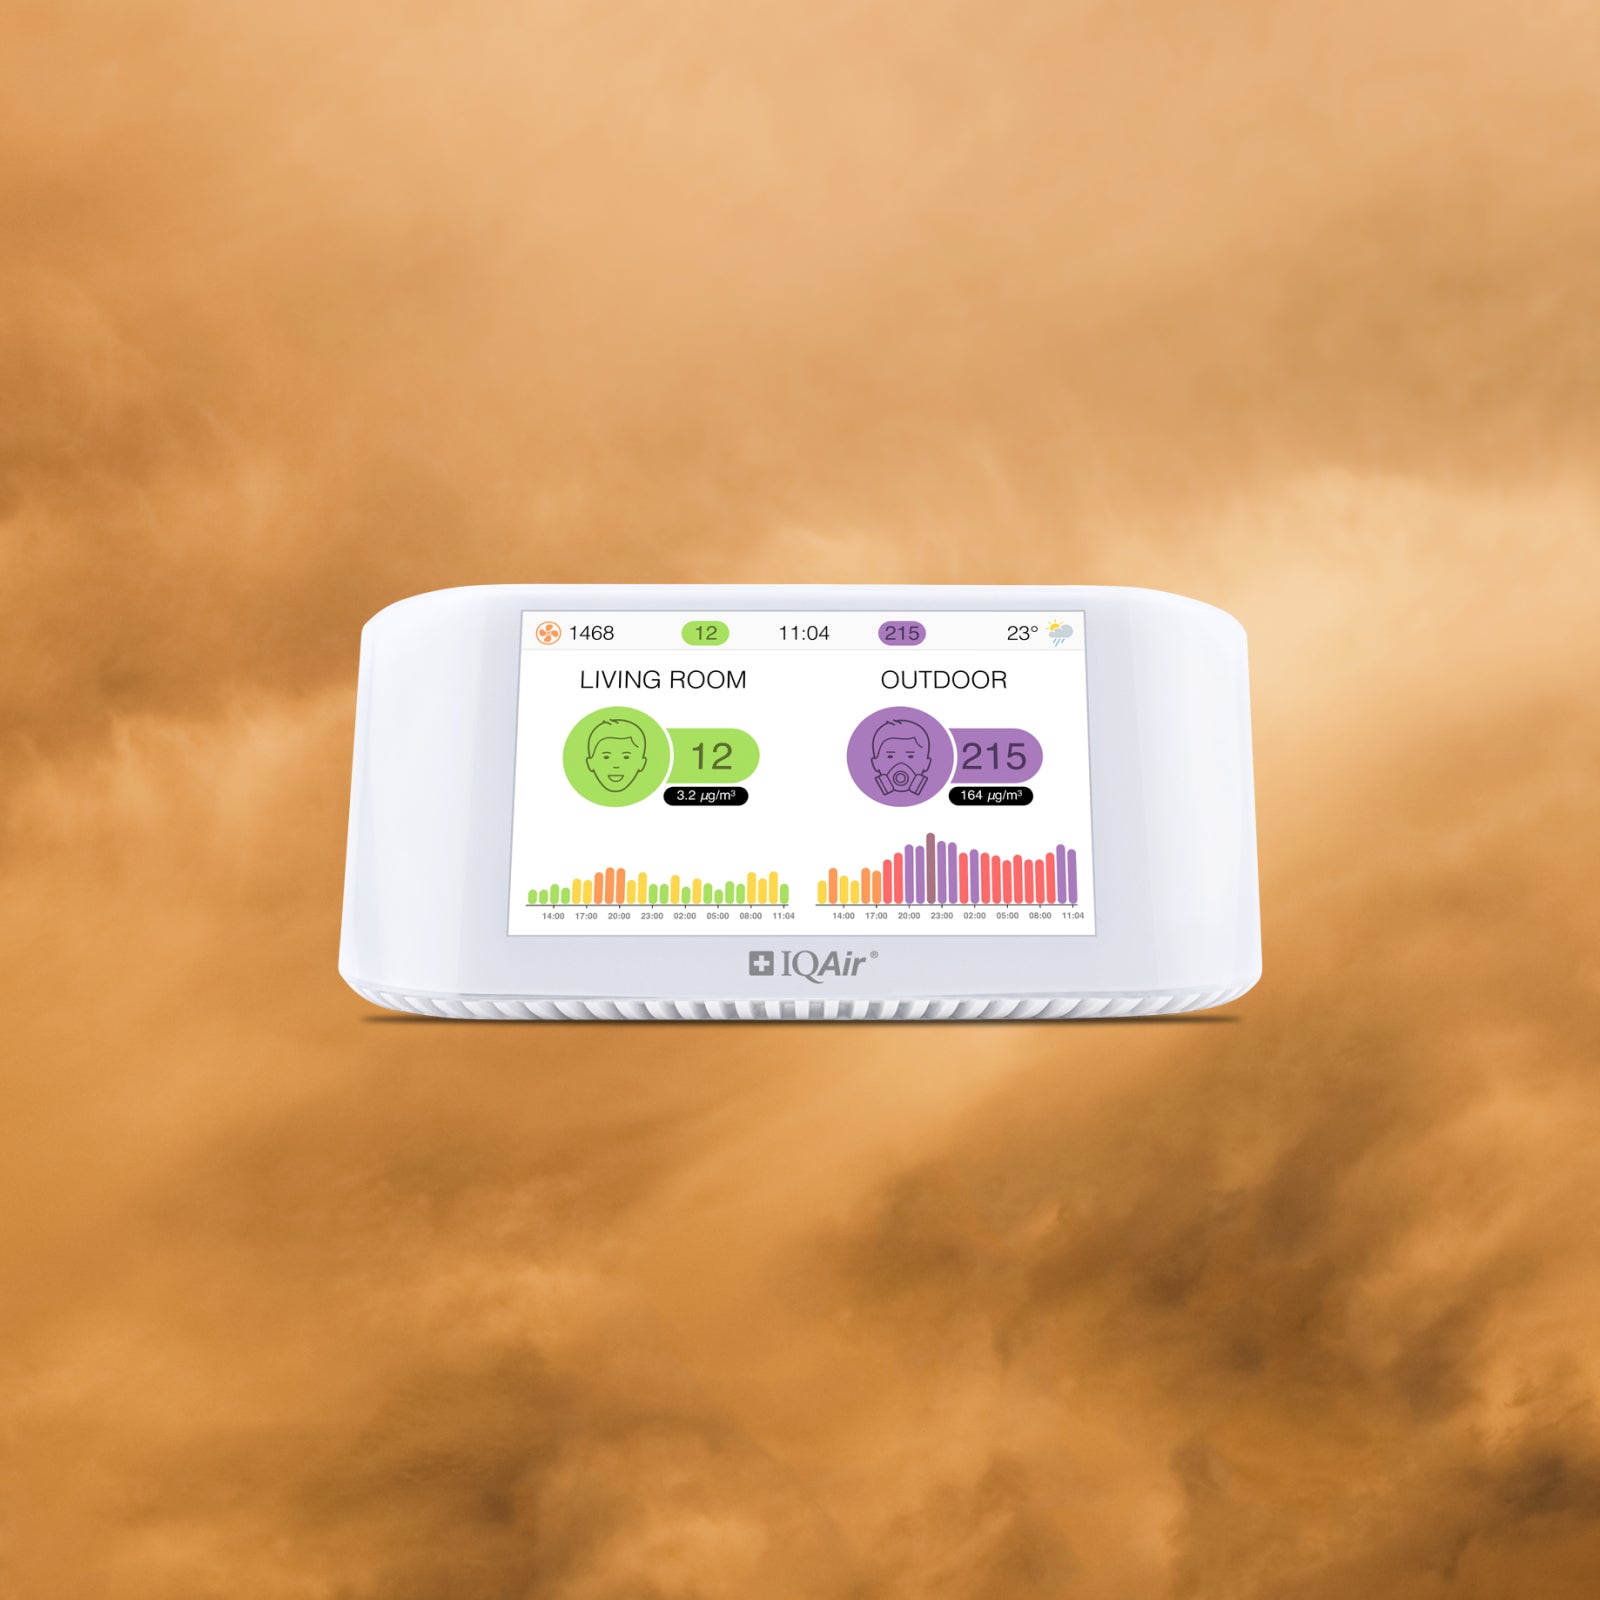
Monitor the air you breathe
Get accurate AirVisual air quality readings and real-time insights for cleaner air. Monitors that reveal pollution sources, highlight when air purifier use is needed.
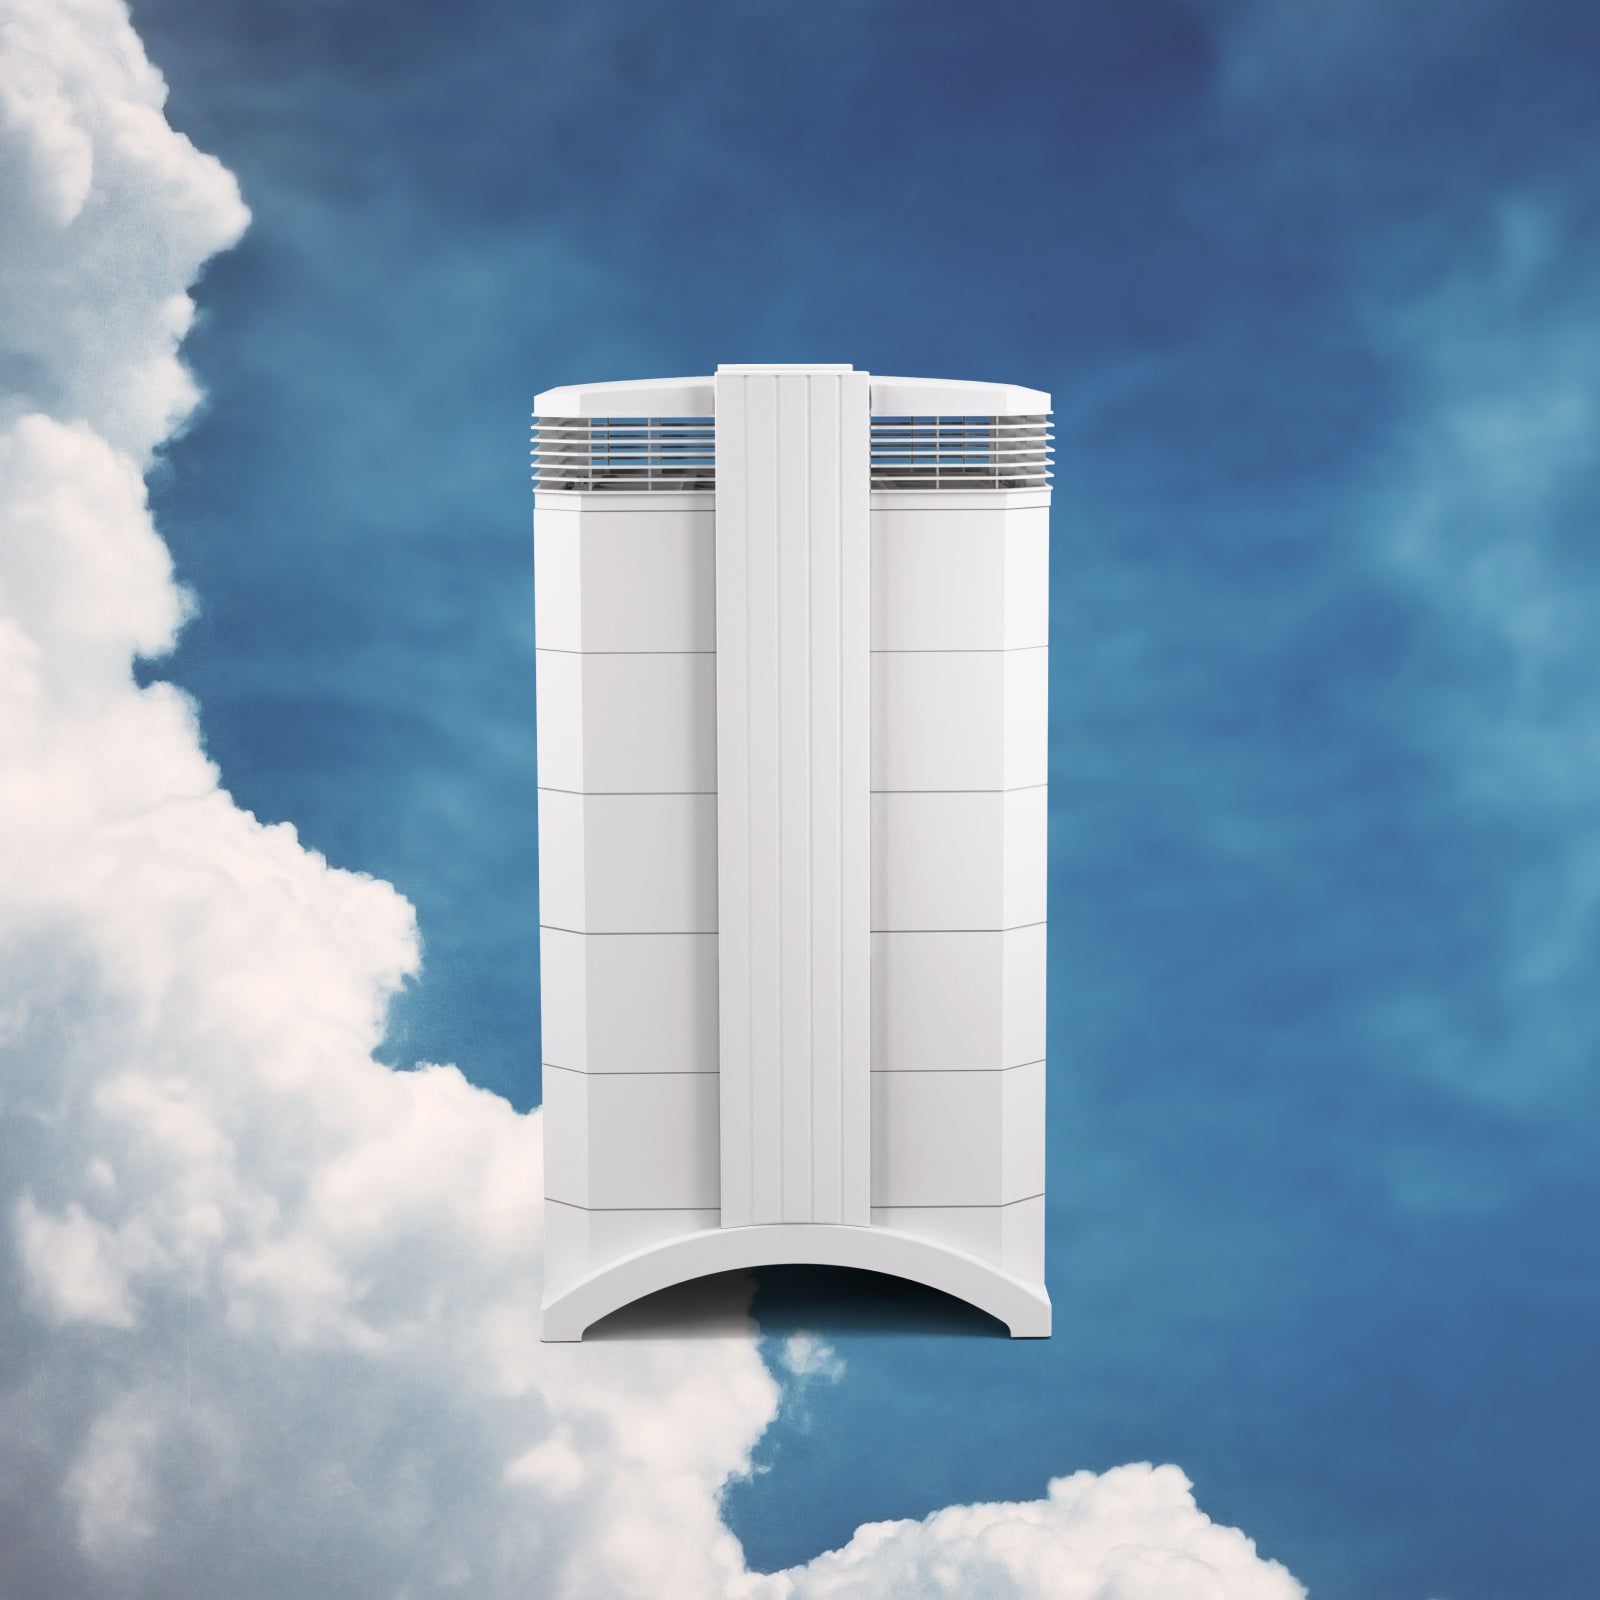
Medical grade air purifiers
Trusted worldwide, the HealthPro Series uses HyperHEPA technology. Filters ultrafine particles other air purifiers miss, delivering medical-grade protection.
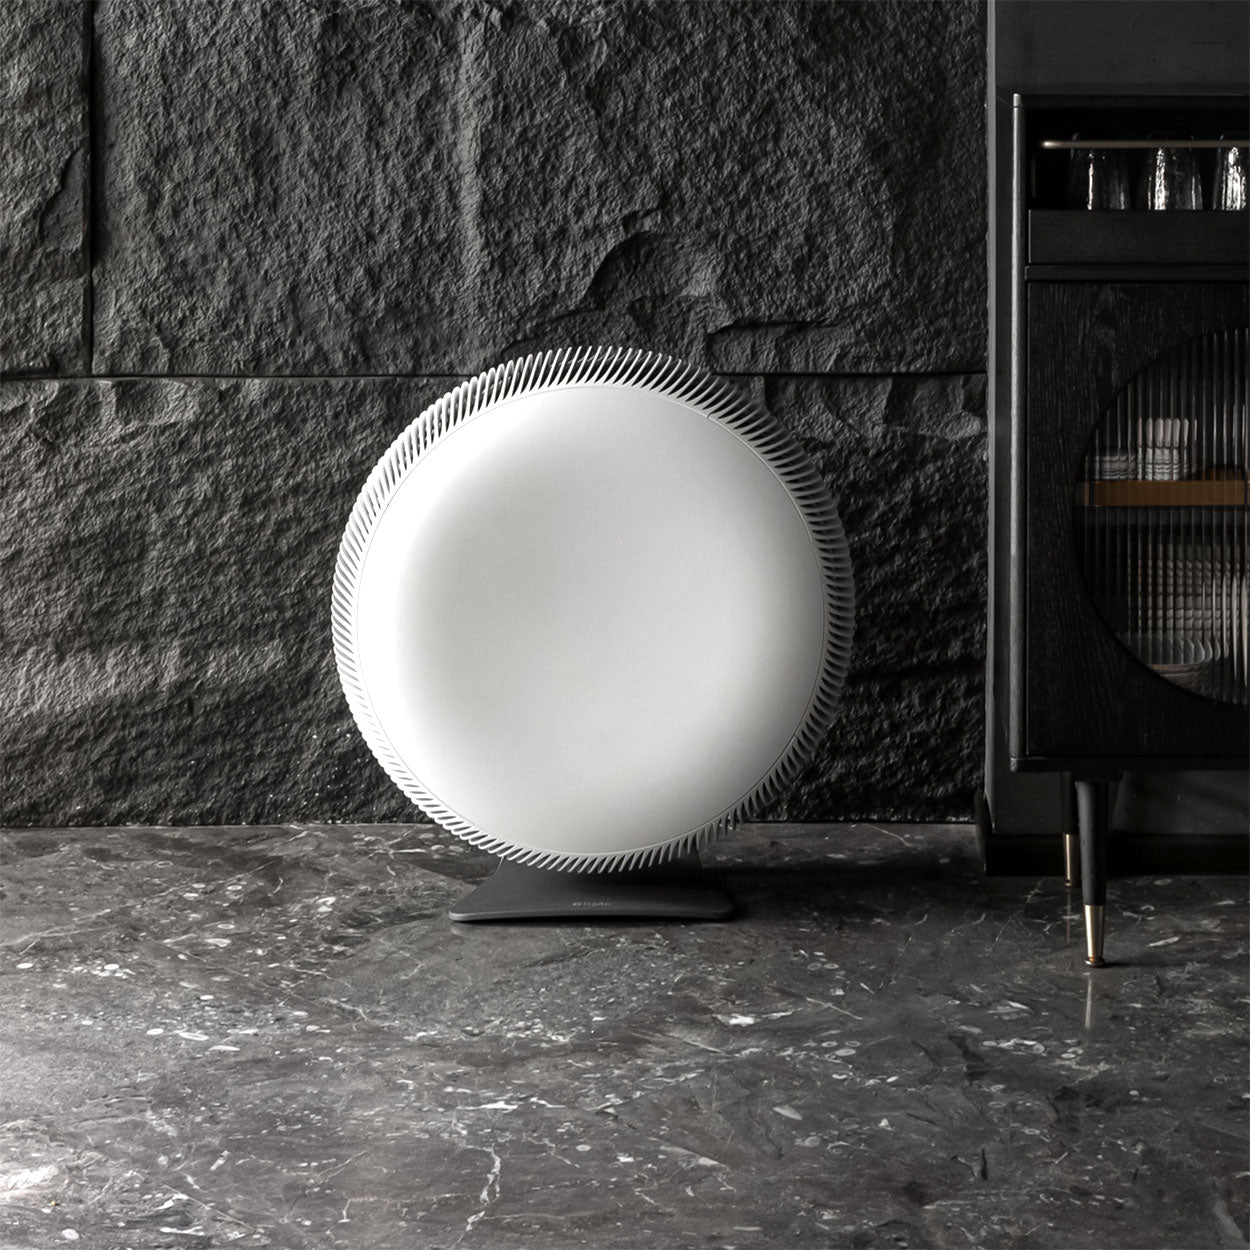
Powerful, stylish air purifiers
Compact and powerful, the Atem Series combines Swiss engineering with high-performance air purification, filtering ultrafine particles with HyperHEPA technology.
Pollen
What is the pollen count in Toronto today?
Index

None
Tree None | 0% |
Grass None | 0% |
Weed None | 0% |
Source:
wetter.comHealth recommendations
Enjoy outdoor activities |
Open your windows to bring clean, fresh air indoors Get a monitor |
Pollen
What is the pollen count in Toronto today?
Index
None
Tree None | 0% |
Grass None | 0% |
Weed None | 0% |
Source:
wetter.comProtect yourself from air pollution in Toronto
Shop IQAir productsWhen the air becomes a problem – we provide relief
Monitor the air you breathe
Get accurate AirVisual air quality readings and real-time insights for cleaner air. Monitors that reveal pollution sources, highlight when air purifier use is needed.
Medical grade air purifiers
Trusted worldwide, the HealthPro Series uses HyperHEPA technology. Filters ultrafine particles other air purifiers miss, delivering medical-grade protection.
Powerful, stylish air purifiers
Compact and powerful, the Atem Series combines Swiss engineering with high-performance air purification, filtering ultrafine particles with HyperHEPA technology.
Most polluted locations near Toronto
Worldwide AQI⁺ rankingStation ranking
Real-time Canada AQI⁺ station ranking
City ranking
Real-time Canada AQI⁺ city ranking
Historic air quality near Toronto
History
Historic air quality graph for Toronto
Historic air quality near Toronto
History
Historic air quality graph for Toronto
Most polluted locations near Toronto
Worldwide AQI⁺ rankingStation ranking
Real-time Canada AQI⁺ station ranking
City ranking
Real-time Canada AQI⁺ city ranking


Measure your own air quality
Get a monitor and contribute air quality data in your city.
Learn more about air pollution in Toronto
Does Toronto have polluted air?
Toronto is a city located in the southern region of Canada, being the capital of the province of Ontario. It is the 4th most populous city in North America, as well as the most populous in Canada itself, with some 2.7 million or more people inhabiting it.
Toronto is also well known as a center for finance and business, seen as the financial district of Canada. Besides media and tech related industries, it is also known for its mass production and exportation of materials and goods related to the industrial sector, producing a variety of metals, vehicles, chemicals and machinery to ship around the world. As such, with any heavily populated city with industries such as these, there are bound to be polluted related issues being a prominent part of year round life.
In 2019 Toronto came in with a PM2.5 average of 7.4 μg/m³, putting into the World Health Organizations (WHO's) target bracket for the best quality of air, with closer to 0 being the most optimal in terms of air cleanliness and breathability. This is a respectable reading for such a largely populated city, one that places it (and Canada) into the upper echelons of least polluted cities and countries across the globe. Toronto’s 2019 reading of 7.4 μg/m³ placed it into 3652nd place out of all cities ranked worldwide, as well as 62nd place out of all cities ranked in Canada.
This shows that the quality of air in Toronto is indeed very good, however it has a few small aspects to it as a whole that can causes some health issues related to pollution, as well as accumulations of smoke and fumes during certain times of the year, which will be discussed in short.
What are the main causes of pollution in Toronto?
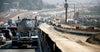
With a large and growing population, Toronto subsequently will have much of its pollution stemming from anthropogenic activities, particularly that of mass movement and transit. It seems that areas that witness the greatest amounts of pollution and cause the greatest concern for health amongst its citizens are areas that have high volumes of traffic.
Busy motorways and city roads that are subject to large amounts of cars often have hazardous readings of chemical compounds and particulate matter around them, both on ground level and in the atmosphere above. Despite having a very well developed public transport infrastructure, many people still stick to travelling and commuting via personal vehicles, with cars and motorbikes taking up large amounts of room on the roads, as well as heavy duty vehicles such as trucks, lorries and buses all contributing to pollution levels, often running on diesel fuels that put out larger amounts of pollution than their smaller or cleaner counterparts would.
The other most prominent cause is that of factory and industrial area emissions, tied directly to the heating of homes and businesses during the long and cold winters that Toronto sees. Much of the fuel used to provide this energy and heat finds itself coming from fossil sources such as coal. On top of this, the industrial areas and factories, besides running on the already polluting fuel sources, will also be putting out large volumes of their own novel pollutants, based primarily on what is being produced at any particular site. It is from these that many toxic chemicals enter the air, along with dangerous forms of fine particulate matter and even heavy metals such as lead, mercury and cadmium.
When is the air quality at its worst in Toronto?
Observing the data taken over 2019 is a great example of year round averages, due to 2020 being subject to worldwide lockdowns and thus reduced levels of pollution because of the covid-19 pandemic. Although the drop in air pollution was indeed a great occurrence as a side effect of a bad situation, it is not truly indicative of how Toronto’s air quality would be under more normal circumstances, hence why 2019 will be looked at.
As such, the months that stood out over 2019 that had the worst quality of air were somewhat sporadic, with the very beginning, middle and end of the year all showing months that had elevated levels of pollution, with the most prominent one being in the first quadrant of the year. Whilst 11 months out of all twelve fell into the WHO's target goal of 10 μg/m³ or less, there was one month to break out of this, which was February that came in with a sizeable reading of 17.2 μg/m³, putting it much further up into the ‘moderate’ pollution bracket, which requires a PM2.5 reading of 12.1 to 35.4 μg/m³ to be classed as such.
This reading is nearly three times that of some of the lower PM2.5 readings, and was followed fairly closely with other more polluted months such as March, July, November and December, which all came in with readings of 9.5 μg/m³, 8.9 μg/m³, 8.5 μg/m³ and 8.8 μg/m³ respectively, showing poorer levels of air quality but not quite matching the worst month of February, with its excessively high jump in pollution levels.
When is the air quality cleanest in Toronto?
In contrast to the previous question, the months that saw the best levels of air quality and lowest PM2.5 readings were placed sporadically between April to October, with some fluctuations occurring but generally being when the air quality was lower and more stable.
From August through to October is when some of the better readings came in, with PM2.5 levels of 6.3 μg/m³, 6.1 μg/m³ and 5.4 μg/m³ all being recorded respectively, making October the cleanest month out of the entire year.
What are the main pollutants in the air in Toronto?
With much of its pollution stemming from sources such as vehicle emissions, alongside factories and industrials areas, the pollutants would have a certain standardization to them. For vehicles, the main offending culprits are nitrogen dioxide (NO2) and sulfur dioxide (SO2), both of which can cause significant harm to people’s respiratory system as well as interfere with the environment.
Other such toxic materials and compounds coming from industrial areas would be a wide range of ones, with black carbon being a prominent material released from the combustion of fossil fuels, along with polycyclic aromatic hydrocarbons, dioxins and furans, as well as volatile organic compounds (VOC's), some of which include benzene, toluene, xylene and formaldehyde.
Whilst these are all harmful to human health, especially when respired over long periods of time, it of note that in cities such as Toronto where the air remains extremely clean for most of the year, a lot of the damage done to health can be location and lifestyle based, with those who live near areas of heavy traffic or industry being the most at risk, as well as commuters themselves who do not take the proper precautionary measures to keep themselves safe from inhaling the aforementioned pollutants.
Where is the cleanest air quality in Toronto?
- Moore Park6
- McLennan Physical Laboratories, Huron Street8
- 11 Corley Ave10
- Ursula Franklin Street13
- 111Pacific Avenue14
- Campus Walk 217
- Markham Street22
- 11-63 Coe Hill Dr23
- Forest Hill North23
- Greenwood & Danforth23
- Hillcrest Village23
- Queens Quay West23
- 19-1 Burton Rd26
- East Toronto26
- Lowther Ave26
- Pauline Ave26
- 376-350 Dundas St E27
- Algonquin Island27
- Wolfrey Avenue27
- The Beaches28
- Toronto Downtown28
- Tweedsmuir Avenue28
- 508-506 Spadina Ave33
- 357 Spadina Cres36
- 548 Spadina Cres37
- Architecture and Design Gallery38
- Ontario Ministry of the Environment Toronto North39
- Ontario Ministry of the Environment Toronto East50
- Ontario Ministry of the Environment Toronto West53
- Toronto Downtown 256
- Wellington Place60